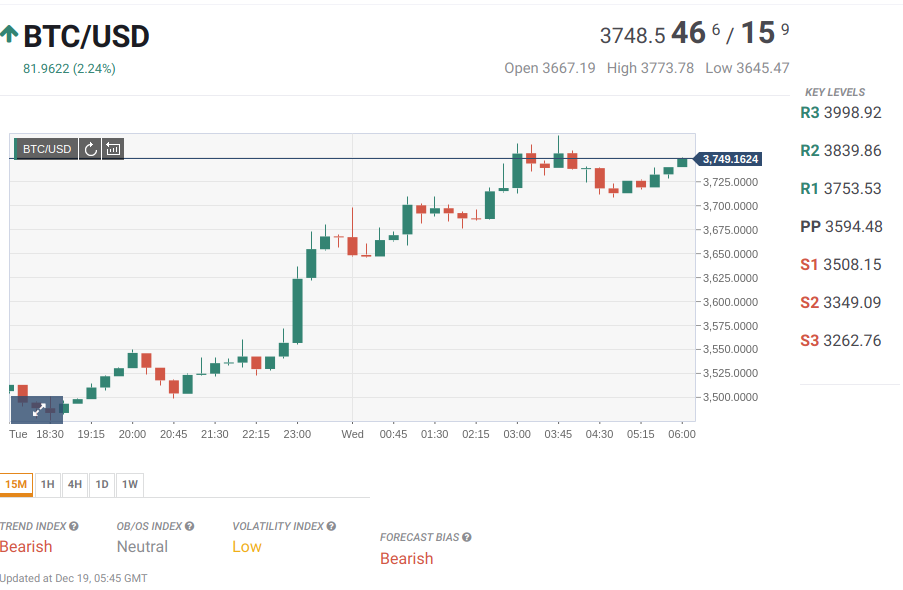
Bitcoin Look out for the Holiday Bear Trap

Bitcoin – Look out for the Holiday Bear Trap

Bitcoin – Look out for the Holiday Bear Trap

Bitcoin in positive territory early on, though will need to hit $4,000 levels to avoid a reversal later in the day.


Bitcoin slid by 5.58% on Tuesday, reversing Monday’s 1.67% gain, to end the day at $3,909.6, a first sub-$4,000 end of day since last Friday’s $3,976.


A broad based cryptomarket sell-off came at the start of the day, with Bitcoin sliding from an intraday high $4,155 to a morning low $3,827.9, the reversal seeing Bitcoin fall through the first major support level at $4,011.80 and second major support level at $3,882.9 before steadying.


Range bound through the 2nd half of the day, Bitcoin eased to an early afternoon intraday low $3,812.1 before recovering to $3,900 levels, an afternoon high $3,957.7 seeing Bitcoin come up short of $4,000 levels and to pin Bitcoin back from a break back through the first major support level at $4,011.80, leaving the bearish trend intact.


The Bitcoin bulls would have been hoping for another day of gains, off the back of the start of a week bounce from last week’s rally, the news wires hitting the majors in the early hours to give the bears the market for the day.


Tuesday’s sell-off saw the cryptomarket’s total market cap fall back to $131.52bn, while Bitcoin’s dominance held relatively steady, with sub-52% levels continuing to point to some further upside near-term, in spite of the extended bearish trend, formed at early May’s swing hi $9,999.


Get Into Cryptocurrency Trading Today


At the time of writing, Bitcoin was up 1.21% to $3,957.1, moves through the early morning seeing Bitcoin rise from a start of a day morning low $3,883.1 to a morning high $3,990.0 before easing back, the day’s major support and resistance levels left untested early on.


For the day ahead, a move back through the morning high $3,990 would support a run at $4,000 levels, while Bitcoin may come up short of the first major resistance level at $4,105.77 on the day, Bitcoin having failed to break out from $4,300 levels struck on Sunday.


Failure to move back through the morning high $3,990.0 could see Bitcoin pullback to $3,800 levels to bring the first major support level at $3,762.87 into play before any recovery, sub-$3,700 support levels unlikely to be in play through the day.


For the Bitcoin bulls, another positive week is going to be needed to support upward momentum going into the New Year, with Bitcoin needing to take a run at $5,000 levels by year end, else face the prospects of another January reversal.


With the holiday season in full swing, with volumes on the lighter side, though still well above levels seen in the first week of December, amidst the crypto sell-off, supporting Bitcoin and the broader market, though a failure to hold onto $3,900 through this morning could see investors pay later in the day and that’s never a good thing when the global equity markets are in meltdown mode.


Bob Mason

Alan Zibluk Markethive Founding Member

Bitcoin BTCUSD Technical Analysis -Prices climb up as the bulls are back in town

Bitcoin [BTC/USD] Technical Analysis -Prices climb up as the bulls are back in town

Bitcoin [BTC/USD] Technical Analysis -Prices climb up as the bulls are back in town

Bitcoin prices have been seeing a lot of bull rallies right from the start of December since the month holds a lot of sentiments from last year.

At the time of writing, the prices were trading at $4,180 with a market cap of almost $73 billion. The 24-hour trading volume can be seen holding strongly at a massive $7 billion.

Most of the trading volume comes from BitMEX via the trading pair BTC/USD, which contributes a whopping $2 million trading volume.

1 Hour

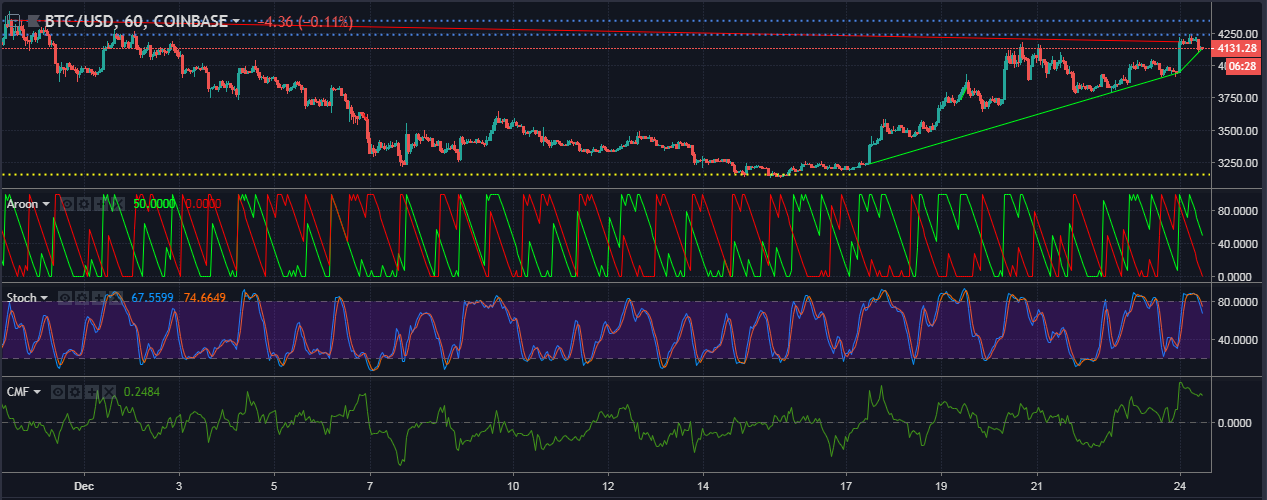
The uptrend for Bitcoin in the one-hour chart seems very bullish as it spans from $3,240 to $4,120, while the downtrend has diminished in size and length as it extends from $4,350 to $4,185. The support for Bitcoin is holding strong at $3,160, while the resistance points are seen hanging above at $4,240 and $4,345.

The Aroon indicator shows that the uptrend for Bitcoin reached the maximum level and is now slowly fading away as it declines towards the zero-line.

The stochastic indicator shows the same as Aroon, as the Stochastic lines reached the top-most level in a bullish crossover and are now heading down in a bearish crossover.

The Chaikin Money Flow shows an overflow of money into the Bitcoin markets as the CMF has hit the top, and is heading down.

1 Day

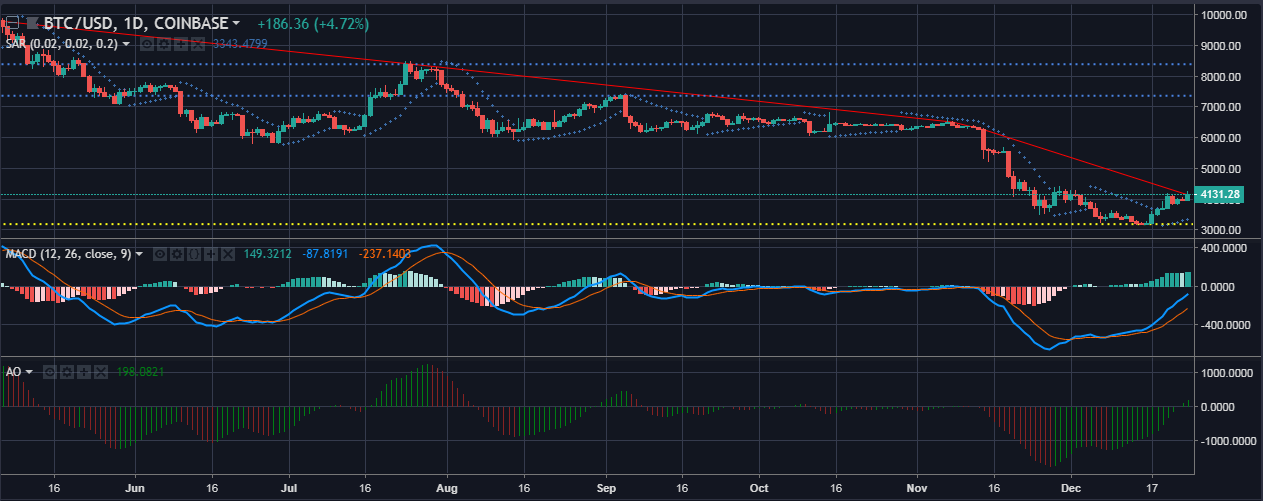
The downtrend for Bitcoin in the one-day chart extends from $9,800 to $4,140 without an uptrend erupting yet. The support for prices can be seen at $3,185 with resistance lines holding the prices from crossing at $8,385 – $7,360.

The Parabolic SAR markers are formed below the price candles which indicates a bullish future for the Bitcoin prices in the larger time frame.

The MACD indicator which had dipped during the sell-off is now recovering in an upward fashion after undergoing a bullish crossover that hasn’t ended yet. The histogram is lit up with green bars above the zero-line.

The Awesome Oscillator shows a bearish crossover as well with the bars that are extending above the zero-line.

Conclusion

The one-day chart shows a decline in Bitcoin’s prices after a brief rally, the same is indicated by the Aroon, Stochastic and the CMF indicators. The one-day chart for Bitcoin shows a positive outlook as indicated by Parabolic SAR, MACD and the Awesome indicators.


Published 7 mins ago on December 25, 2018

By Akash Girimath

Alan Zibluk Markethive Founding Member

Bitcoin approaches Christmas with solid gains

 Bitcoin approaches Christmas with solid gains

Bitcoin approaches Christmas with solid gains

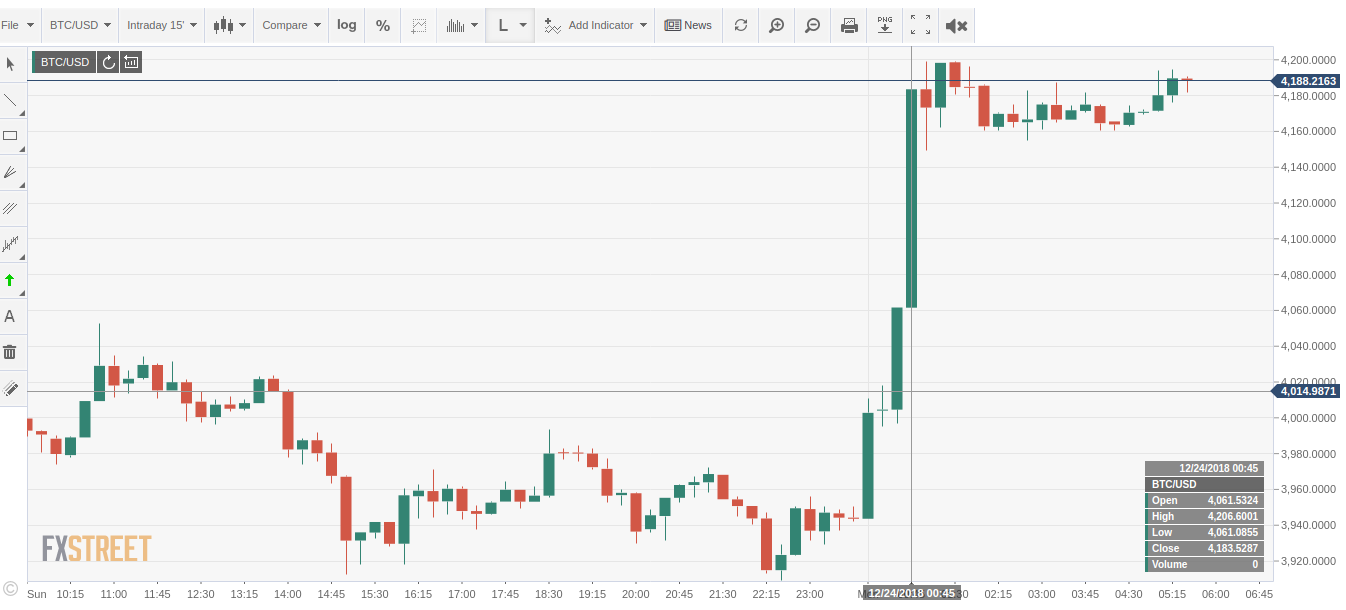
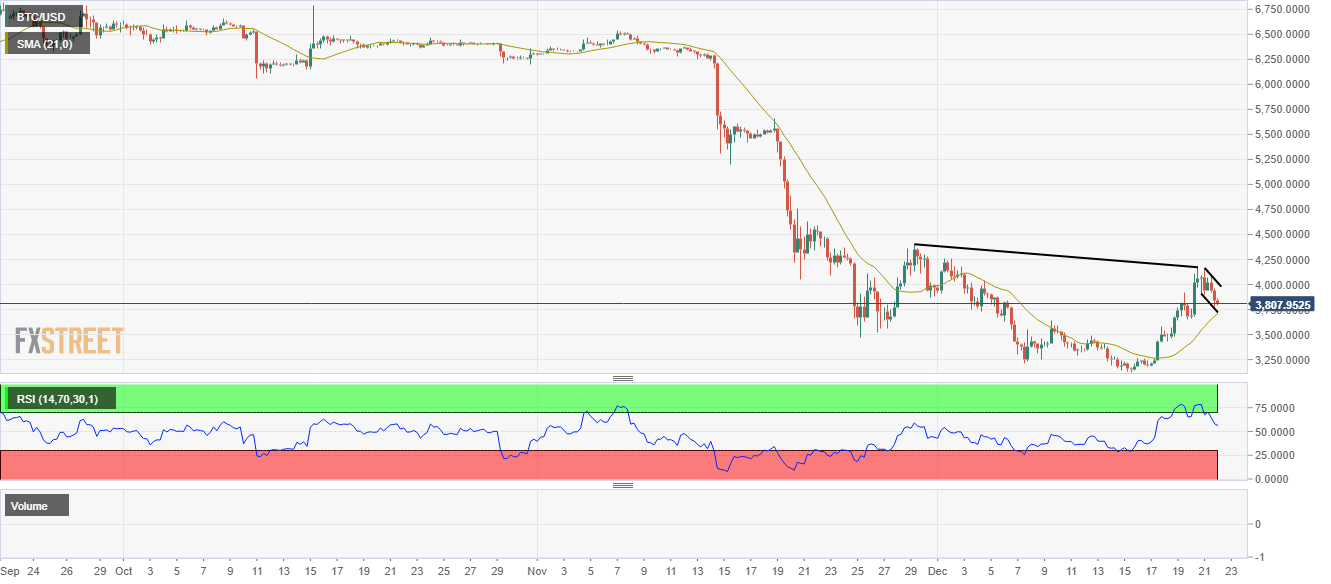
  • Cryptocurrency market is consolidating with a positive bias.

  • Bitcoin and major altcoins had one of the best weeks this year.

Cryptocurrency market had a really good week as the overwhelming majority of top-10 digital assets managed to recover from this year lows. The total value of coins in circulation has reached $142 billion, which is about $40 billion higher than a week ago.

Bitcoin (BTC) gained over 30% since the recent low; however, the palm of victory belongs to Bitcoin Cash (BCH) that catapulted above $200 and returned to the fourth place in the cryptocurrency rating. The coin is 150% higher than a week ago. Tron (TRX) gained 65% to trade at $0.021 at the time of writing, while Ethereum (ETH) and EOS also became more expensive than a week ago. ETH/USD is trading at $150 after a short-lived spike above $154 handle; EOS/USD has settled marginally above critical $3.00.

A strong positive momentum improved forecasts, though some experts stay cautious. Thus, Peter Brandt, a 71-year-old trading veteran, said that Bitcoin's move above $4,000 was just a dead-cat bounce. He believes that the price will bottom out somewhere closer to $1,200. The cautious approach is understandable as the market has made several false recovery attempts during this year.


Tanya Abrosimova

FXStreet

Alan Zibluk Markethive Founding Member

Bitcoin Price Weekly Analysis – BTC Primed To Test 5000

Bitcoin Price Weekly Analysis -  BTC Primed To Test $5,000

Bitcoin Price Weekly Analysis – BTC Primed To Test $5,000

Key Points

  • Bitcoin price gained pace recently and broke the $3,580 and $3,780 resistances against the US Dollar.

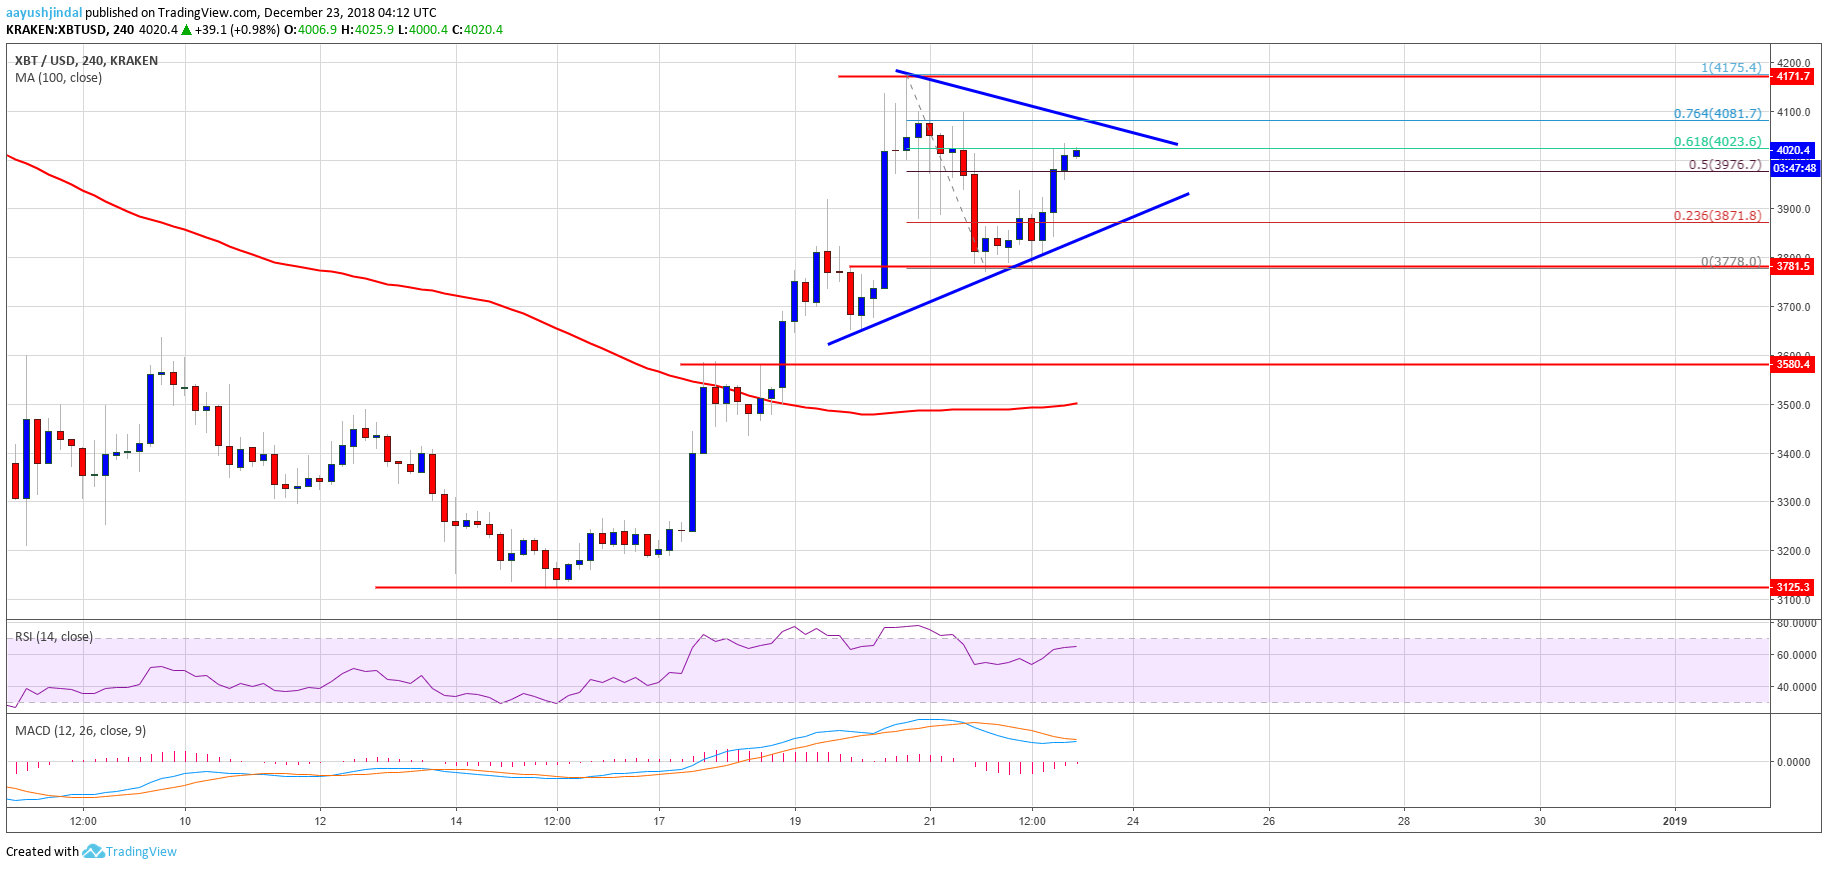
  • There is a major symmetrical triangle forming with resistance at $4,080 on the 4-hours chart of the BTC/USD pair (data feed from Kraken).

The pair is likely to break the $4,080 and $4,150 resistance levels to rally towards $4,500 or $5,000.

Bitcoin price is placed in an uptrend above $3,580 against the US Dollar. BTC/USD is likely to extend the current bullish wave towards $4,500 or $5,000.

Bitcoin Price Analysis

This past week, bitcoin price started a solid upward move above the $3,200 resistance against the US Dollar. The BTC/USD pair surged above the $3,580 and $3,780 resistance levels. There was even a close above the $3,780 barrier and the 100 simple moving average (4-hours). An intermediate high was formed near $4,175 and recently the price corrected lower. It broke the $3,900 level, but the $3,780 level acted as a solid support.

The price started a fresh upside and broke the $3,900 resistance. It even broke the 50% Fib retracement level of the recent decline from the $4,175 high to $3,778 low. More importantly, there is a major symmetrical triangle forming with resistance at $4,080 on the 4-hours chart of the BTC/USD pair. The triangle seems to be a bullish continuation pattern towards the $4,175 and $4,300 levels. A successful break above the $4,100 and $4,150 levels is needed for further gains. Once there is a break above $4,175, the price could rally towards $4,500 or $5,000.

Looking at the chart, BTC price remains well supported on dips near the $3,900 and $3,780 levels. As long as there is no close above the $3,580 pivot, the price is likely to surge towards $4,200, $4,500 or even $5,000.

Looking at the technical indicators:

4-hours MACD – The MACD for BTC/USD is about to move into the bullish zone.

4-hours RSI (Relative Strength Index) – The RSI is well above the 60 level.

Major Support Level – $3,780

Major Resistance Level – $4,175


AAYUSH JINDAL | DECEMBER 23, 2018 | 5:00 AM


Alan Zibluk Markethive Founding Member

Bitcoin – Cup and handle in the making?


Bitcoin – Cup and handle in the making?

  • BTC in the process of making bullish cup and handle pattern.

  • Needs to consolidate recent gains for further gains to occur.

Bitcoin, the largest cryptocurreny by market capitalisation, is in the process of forming a cup and handle pattern, which is a bullish sign for the prices. The only thing required is price consolidation to complete the formation of handle and then a breakout above the line of a cup.

BTC/USD is down seven cents of a percent at $3,814 and trading in less than 3 percent range for the day in a low volatility weekend trading – good sign for the cup and handle formation to take shape on 360-minute chart of BTC.

Prices have declined a bit after recent gains and few more bars of consolidation on this time scale and a breakout above $4,160-70 is all that the bulls need for the prices to break out. Target of this breakout would be around $5,200. But, for the longer price trend to change up, bulls will need some more strength to cross past $5,790, which is its 21 weeks SMA.

BTC/USD 360-minute chart:


Manoj B Rawal

FXStreet


Bitcoin - Cup and handle in the making?

Alan Zibluk Markethive Founding Member

Bitcoin Outdoes Itself Moves Beyond 4000

Bitcoin Outdoes Itself; Moves Beyond $4,000

Bitcoin Outdoes Itself; Moves Beyond $4,000

At press time, bitcoin has pushed beyond the $4,000 mark for the first time in two weeks. What has started out as an ongoing “slump ride,” the asset has seemingly found enough strength to challenge present resistance levels and fight back against the ever-present bears.

Bitcoin has been performing poorly for about a month. Trouble began in early November when the currency fell from the $6,000 range – where it had been all summer and autumn – down to the high $5,000s, likely in anticipation of the upcoming bitcoin cash hard fork that occurred prior to Thanksgiving week. From there, the currency fell into the $4,000 range, and then $3,000 once the fork occurred.

Bitcoin Is Gaining Some Ground

Bitcoin cash pitted several industry leaders, i.e. Craig Wright and Roger Ver, against one another. Though it has forked in the past, none of those events led to the controversy enthusiasts witnessed this time around. The atmosphere in the crypto space has been one of confusion and skepticism, partially leading to further drops in bitcoin’s price. Several analysts saw the asset falling to $1,500 or less before signs of recovery would potentially appear.

Just last week, the father of crypto fell to approximately $3,175, its lowest position in approximately 15 months. However, with this sudden (and meteoric) rise in such a short amount of time, the currency appears to be challenging the barricades that have placed themselves in its path. The big question is whether it can keep this momentum going, or if things will crash and burn further.

Interestingly, these good price waves are also affecting bitcoin cash. The currency fell to the low $300s following the controversial fork, but the descent didn’t quite stop there. Eventually, it had made its way below the $150 and $100 marks.

At the time of writing, however, the currency has managed to retain its position as a leading asset and is now testing the $150 resistance level against the U.S. dollar. It is also being reported that percentage gains for bitcoin cash are higher than those of major competitor’s like Ethereum and Ripple.

In the past, we have seen similar December rallies for bitcoin and its crypto cousins. Last year, for instance, is when the currency reached its all-time high of nearly $20,000. For the most part, it’s still in a relatively low position, but figures like Charles Hayter – chief executive of Crypto Compare – suggest that now is the time to get back in and buy. Could this mark the beginning of a very positive 2019?

Should You be Buying Bitcoin Again?

Speaking with CNBC, Hayter explained:

“The maxim of buy when there’s blood on the streets could be influencing some to gain exposure at this nadir prior to the new year.”


NICK MARINOFF · DECEMBER 21, 2018 · 12:00 AM

Alan Zibluk Markethive Founding Member

Bitcoin BTC Daily Price Forecast December 20

Bitcoin (BTC) Daily Price Forecast – December 20

Bitcoin (BTC) Daily Price Forecast – December 20

c

BTC/USD Medium-term Trend: Bullish

Resistance Levels: $6,800, $6,900, $7,000

Support levels: $3,700, $3,600, $3,500

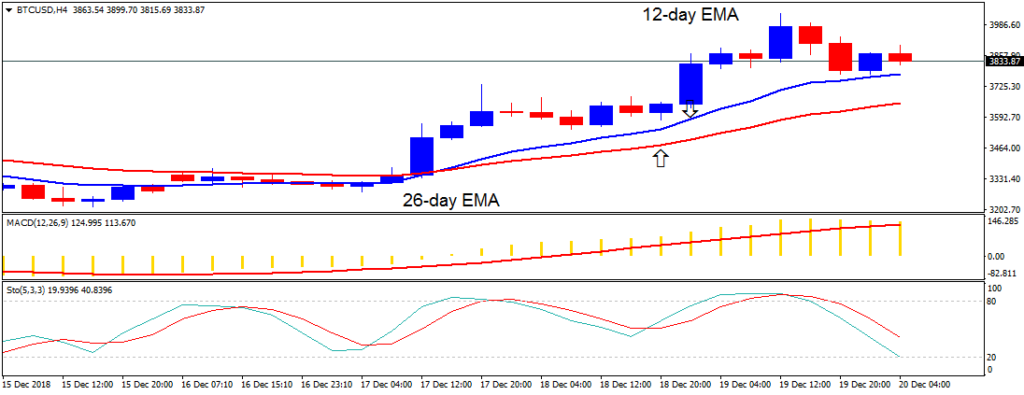
Yesterday, December 19, the price of Bitcoin was in a bullish trend. The price of Bitcoin is above the 12-day EMA and the 26-day EMA indicating that price is likely to rise. The crypto’s price reached the high of $3,950 but was resisted at the $4,000 price level.

The BTC price is now retracing from the recent high. If price retraces, it may retrace to the moving averages and resume its uptrend. However, if price retraces and breaks 12-day EMA and the 26-day EMA, the price of Bitcoin will resume its downward trend. Meanwhile, the Stochastic is in the range below the 40% range. This implies that the price of Bitcoin has a bearish momentum


BTC/USD Short-term Trend: Ranging

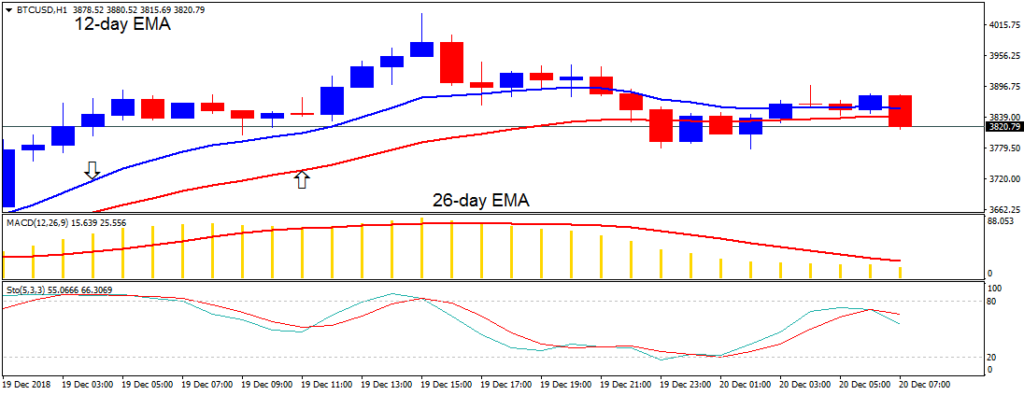
On the 1-hour chart, the price of Bitcoin was in a bearish trend. The price of Bitcoin is now below the 12-day EMA and the 26-day EMA which indicates that price is in the bearish trend zone. The MACD line and the signal line are below the zero line which indicates a sell signal. Also, the stochastic indicator is in the range below the 80% range. That is, the BTC price has a bearish momentum and a sell signal.


By Azeez M – December 20, 2018

Alan Zibluk Markethive Founding Member

Here are two reasons to buy Bitcoin right now

Here are two reasons to buy Bitcoin right now

Here are two reasons to buy Bitcoin right now

  • Bitcoin long-term seller just closed his short position with a profit.

  • Candlestick pattern on a daily chart hints on a trend reversal.

Bitcoin bulls have another reason to rejoice. Mark Dow, a former International Monetary Fund economist and, more importantly, the guy who entered Bitcoin short right at the top of the last year's rally, just closed his position.

“I’m done. I don’t want to try to ride this thing to zero. I don’t want to try to squeeze more out of the lemon. I don’t want to think about it. It seemed like the right time,” he said in phone interview with Bloomberg.

He explained that he saw some psychological hallmarks during the euphoria that surrounded Bitcoin last December. Those signals told him that the market had reached a breaking point.

"People buy into these assets because they believe the narrative, and you look at the asset prices to see if the narrative is weakening or changing. It’s not easy — you could be wrong, but that’s the sign you look for. But it doesn’t mean you’ll get it right," he added.

Currently, BTC/USD is changing hands at $3,730, gaining over 6% on a day-to-day basis. The digital coin No. 1 has been growing strongly for the third day in a row, creating an exciting candlestick pattern on a daily chart.

Three White Soldiers are on the assault mission

On the daily chart, a candlestick pattern "Three White Soldiers" is being formed. If Bitcoin manages to maintain the rally during the day, we will have and strong long-term reversal signal. "White Soldiers has come after a short period of indecisive trading that followed a strong bearish trend. Big bullish candles with small shadows imply that bulls are growing stronger and ready to snatch the control over the situation. For the pattern to be confirmed, we will need to see a daily close above $3,800 handle.


Tanya Abrosimova FX Street

Alan Zibluk Markethive Founding Member

CNBC’s Brian Kelly Is Reportedly Short on Bitcoin

CNBC's Brian Kelly Is Reportedly Short on Bitcoin

CNBC’s Brian Kelly Is Reportedly Short on Bitcoin

Brian Kelly – often described as CNBC’s “uber” bitcoin bull – is allegedly short bitcoin.

The news came forth in a new podcast published on Zerohedge.com. The bitcoin market has been seriously crashing over the past few days. Late last week, the currency struck the $3,100 range for the first time in over 15 months, though at press time, the price has risen back up to roughly $3,400. The currency does appear to be showing signs of recovering, though it’s hard to say how long it will last or where it will wind up at the end of 2018.

Bitcoin in Crisis?

The podcast – entitled “Quoth the Raven,” taken from Edgar Allan Poe’s most famous poem – says that Brian Kelly is short bitcoin, and potentially has been for some time. Kelly has served as a cryptocurrency analyst with CNBC for several years. On a recent program, Kelly allegedly claimed that he was “net short,” something he has yet to state in the past.

Only a few months ago, Kelly purportedly stated that he’s so confident in BTC and its crypto-cousins that he’s placed approximately 90 percent of his wealth into digital assets. The podcast was particularly critical of Kelly’s casual attitude when announcing that he was short. The podcast speaker jokes that the asset has not entered a “bear market,” but is stuck in an “as*hole market,” and that the bear has come down crashing at 15,000 miles per hour. At the time of writing, bitcoin has fallen by over 80 percent since it reached its all-time high of nearly $20,000 last December.

In addition, the podcast claims that Kelly repeatedly pumped BTC to potentially get listeners interested and investing in the currency to boost its price.

The father of crypto has been falling steadily since the beginning of the year. Last summer, the asset spent most of the time hovering in the $6,000 range. In June, it temporarily fell below the $6,000 mark and entered $5,000 territory, causing widespread panic.

Kelly, however, remained adamant that bitcoin was not ready to die, alleging that a series of recent hacks and selloffs were responsible for the sudden drop.

Bitcoin Is Still Alive

On CNBC, he commented:

“This is not the funeral for bitcoin, whatsoever. Let’s put this in perspective. Do you know where we were a year ago? $2,500. Bear markets, we don’t know where they end. It doesn’t mean that bitcoin can’t go lower, but this is by no means the funeral for bitcoin.”
 

NICK MARINOFF · DECEMBER 18, 2018 · 12:13 AM

Alan Zibluk Markethive Founding Member

Look Mom I have a Blog