Bitcoin Price Technical Analysis for 03/23/2018 – Another Reversal Pattern
Bitcoin Price Key Highlights
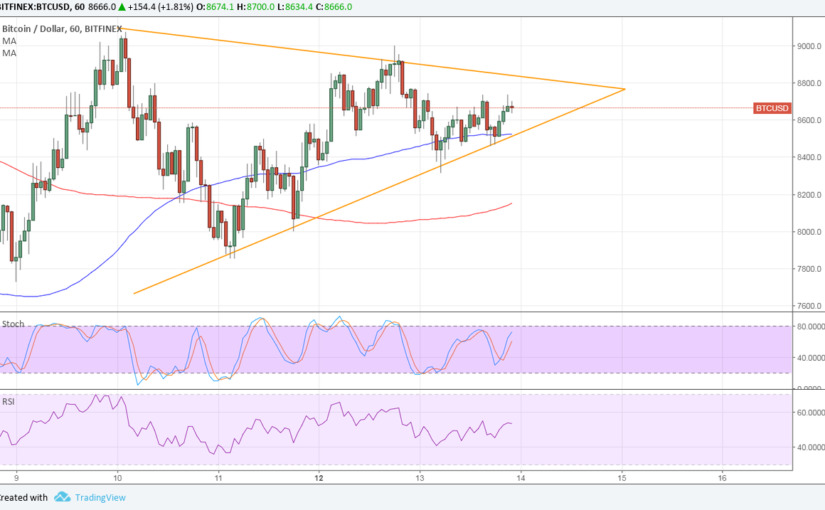
Bitcoin price failed to break past the $9,000 level after news of a potential shutdown of Binance in Japan broke out.
However, bitcoin price could still form an inverse head and shoulders pattern, which is a potent reversal signal.
Technical indicators are showing that bullish momentum could stay in play.
Bitcoin price sold off recently but could form a short-term reversal pattern on its 1-hour time frame and draw more buyers back in.
Technical Indicators Signals
The 100 SMA just crossed above the longer-term 200 SMA to signal that buyers are gaining the upper hand. The 200 SMA is also holding as dynamic support at the moment, but a break lower could lead to another pickup in selling pressure.
Stochastic is pointing down to show that bears have the upper hand while RSI is turning lower as well. Both oscillators are nearing oversold conditions, though, so sellers could still let buyers take over soon.
An area of interest is located around $8,000 and a bounce from here could form the right shoulder of the reversal pattern. Bitcoin price has yet to break past the neckline around $9,200 to confirm a potential uptrend. This should last by around $2,000 or the same height as the chart formation.
Bitcoin Price Key Highlights
Bitcoin price failed to break past the $9,000 level after news of a potential shutdown of Binance in Japan broke out.
However, bitcoin price could still form an inverse head and shoulders pattern, which is a potent reversal signal.
Technical indicators are showing that bullish momentum could stay in play.
Bitcoin price sold off recently but could form a short-term reversal pattern on its 1-hour time frame and draw more buyers back in.
Technical Indicators Signals
The 100 SMA just crossed above the longer-term 200 SMA to signal that buyers are gaining the upper hand. The 200 SMA is also holding as dynamic support at the moment, but a break lower could lead to another pickup in selling pressure.
Stochastic is pointing down to show that bears have the upper hand while RSI is turning lower as well. Both oscillators are nearing oversold conditions, though, so sellers could still let buyers take over soon.
An area of interest is located around $8,000 and a bounce from here could form the right shoulder of the reversal pattern. Bitcoin price has yet to break past the neckline around $9,200 to confirm a potential uptrend. This should last by around $2,000 or the same height as the chart formation.
Author: SARAH JENN • MAR 23, 2018 • 04:03
Posted by David Ogden Entrepreneur
Alan Zibluk – Markethive Founding Member