Tag Archives: IOTA

Bitcoin, Ethereum, Bitcoin Cash, Ripple, Stellar, Litecoin, Cardano, IOTA, EOS – Price Analysis, 4th May

Bitcoin, Ethereum, Bitcoin Cash, Ripple, Stellar, Litecoin, Cardano, IOTA, EOS - Price Analysis, 4th May

Bitcoin, Ethereum, Bitcoin Cash, Ripple, Stellar, Litecoin, Cardano, IOTA, EOS – Price Analysis, 4th May

Goldman Sachs, one of the biggest investment banks in the world, is taking the plunge into the exciting world of cryptocurrency trading. The bank’s decision was made because of the overwhelming client requests.

This is a very positive sign for the crypto market’s future along with the news about analysts from BlackRock, an American global investment management company, leaving the firm to fund a Blockchain-focused venture capital fund. Other places where the banks or institutions are still pondering over their decision, the analysts are quitting to open their own ventures. Investors plowing money into these funds shows a growing interest.

After the decline from the frothy levels in December 2017, the investors are getting a favorable entry opportunity. In the past few weeks, the volatility has also reduced, which is an added attraction to get in early.

While the number of crypto optimists has increased, there is no dearth of the naysayers as well. Economist Nouriel Roubini continued his criticism of cryptocurrencies. While he may have forecast the 2008 Financial crisis correctly, his crypto prediction seems to be way off.
But there are positive predictions as well.  Alexis Ohanian, a co-founder of Reddit, claims that Ethereum is on its way to $15,000 this year.

We already hold a few positions. Let’s see if the charts present us any fresh buying opportunities?
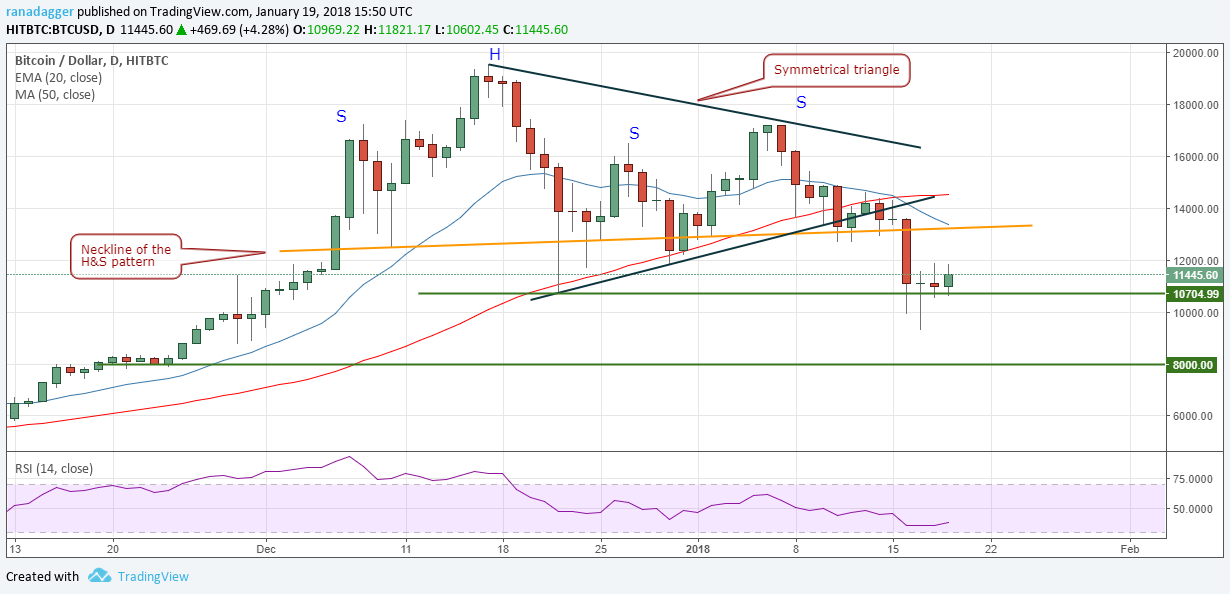
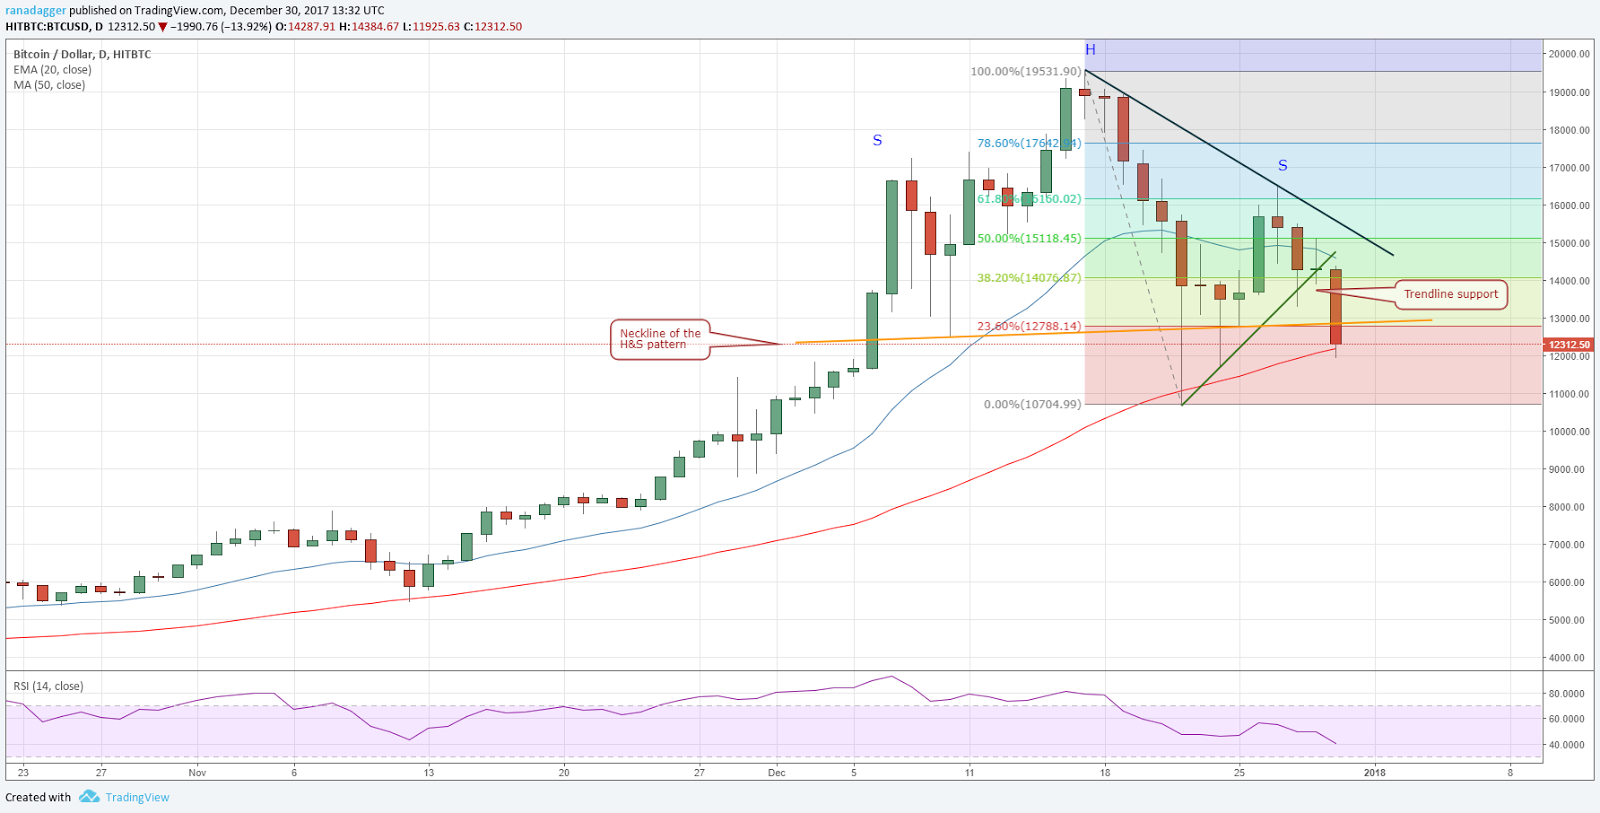
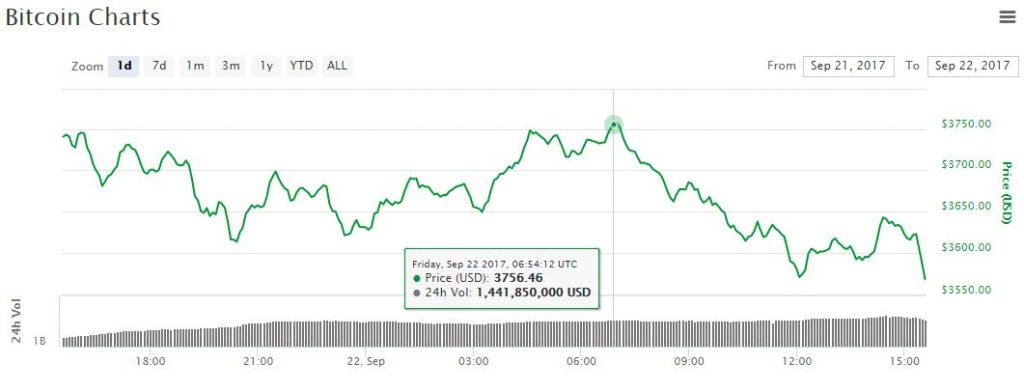
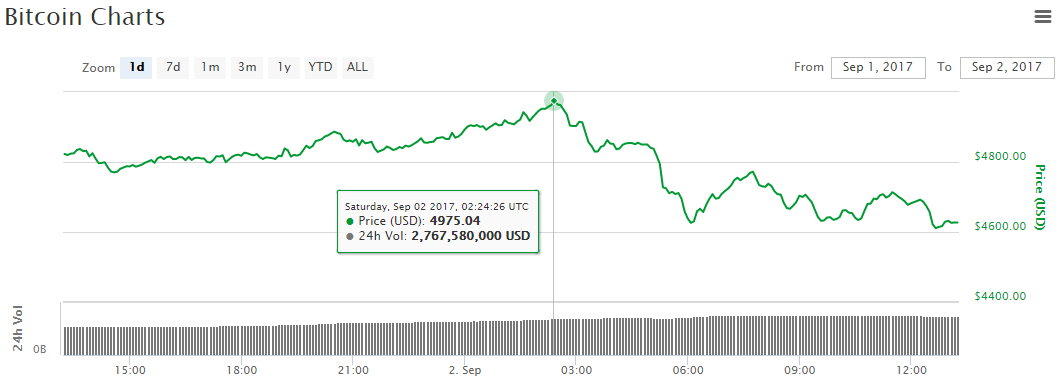
BTC/USD
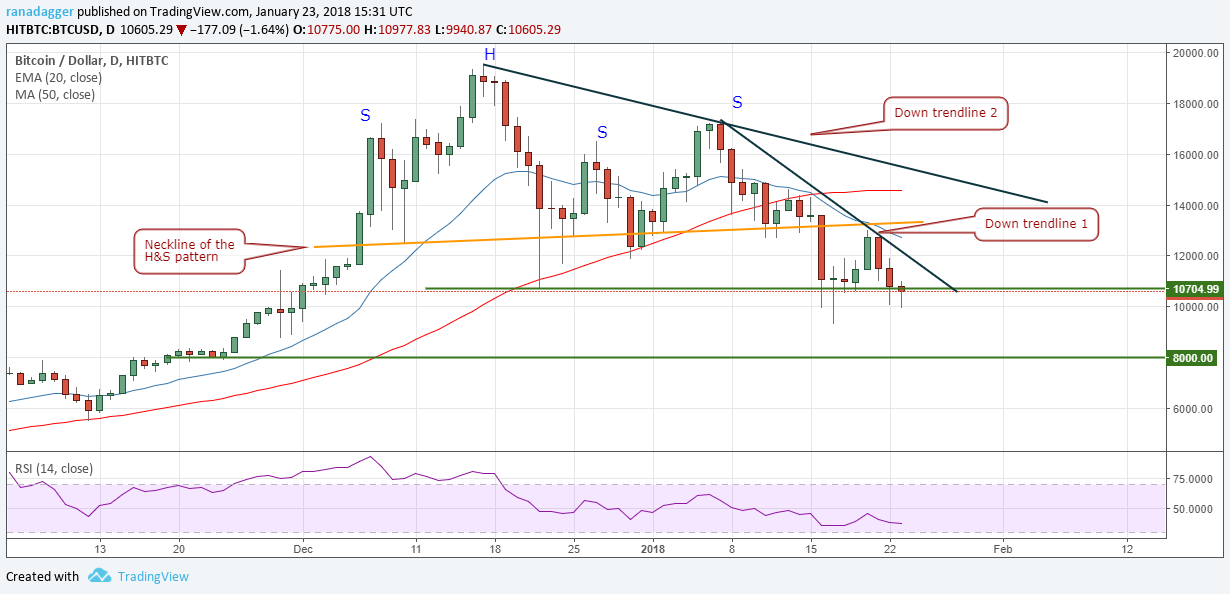
Bitcoin broke out of the small symmetrical triangle pattern and entered the ascending channel on May 03, which is a bullish sign. Currently, it is facing resistance close to the April 25 highs, but we remain bullish because it has not given up ground.

If the digital currency rises from the support line of the ascending channel, it increases the possibility of a break out above the immediate resistance zone of $9,800 to $10,000.

Following the breakout, the first target is $11,000, and the next target is $12,000. We anticipate a strong resistance at the $12,172.43 mark.

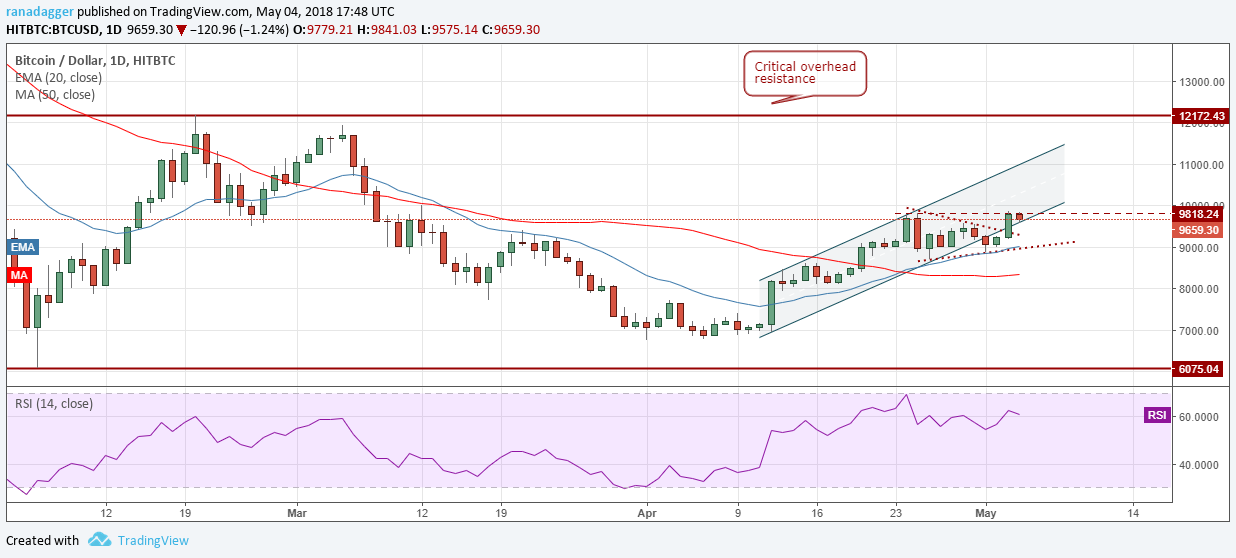
On the downside, if the BTC/USD pair breaks below the support line of the ascending channel, it can fall to $9,178 and then to the 20-day EMA, close to $9,000 levels.

The up move will be in danger only on a break below $9,000 levels. Therefore, we suggest raising the stops on the long positions from $8,600 to $8,900.
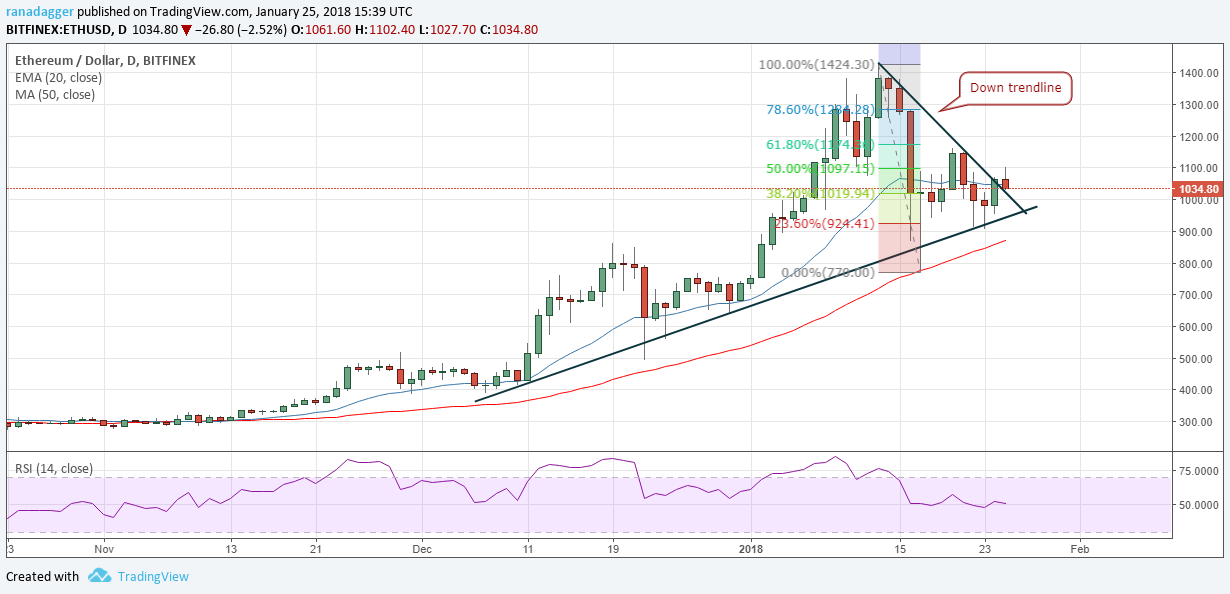
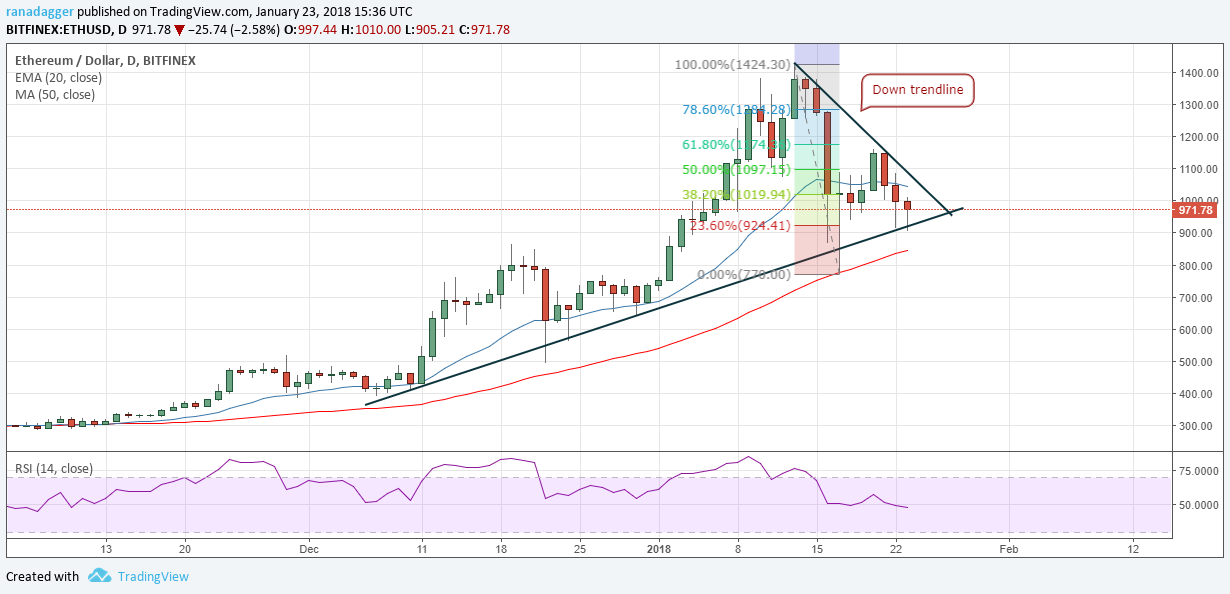
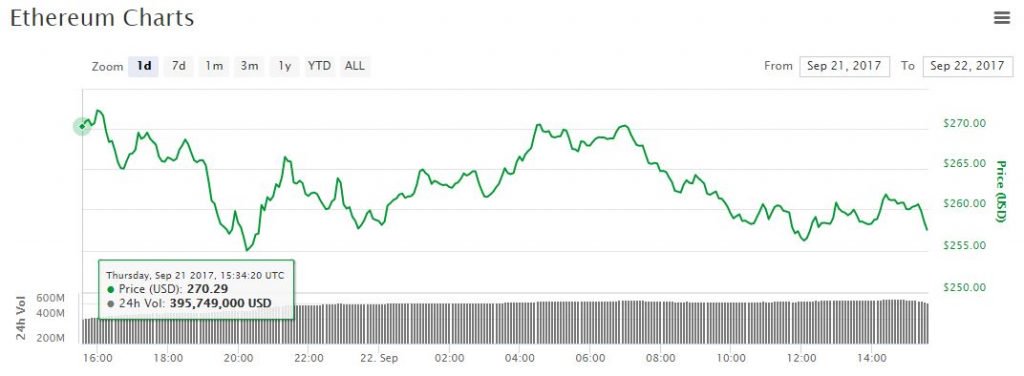
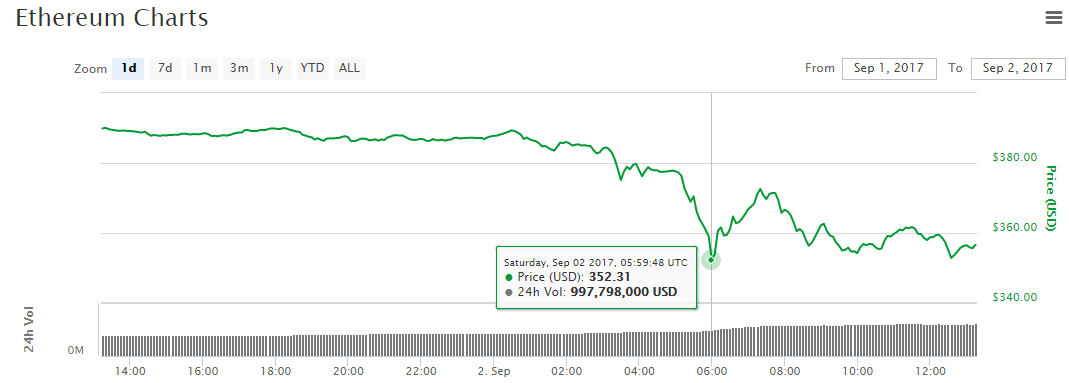
ETH/USD
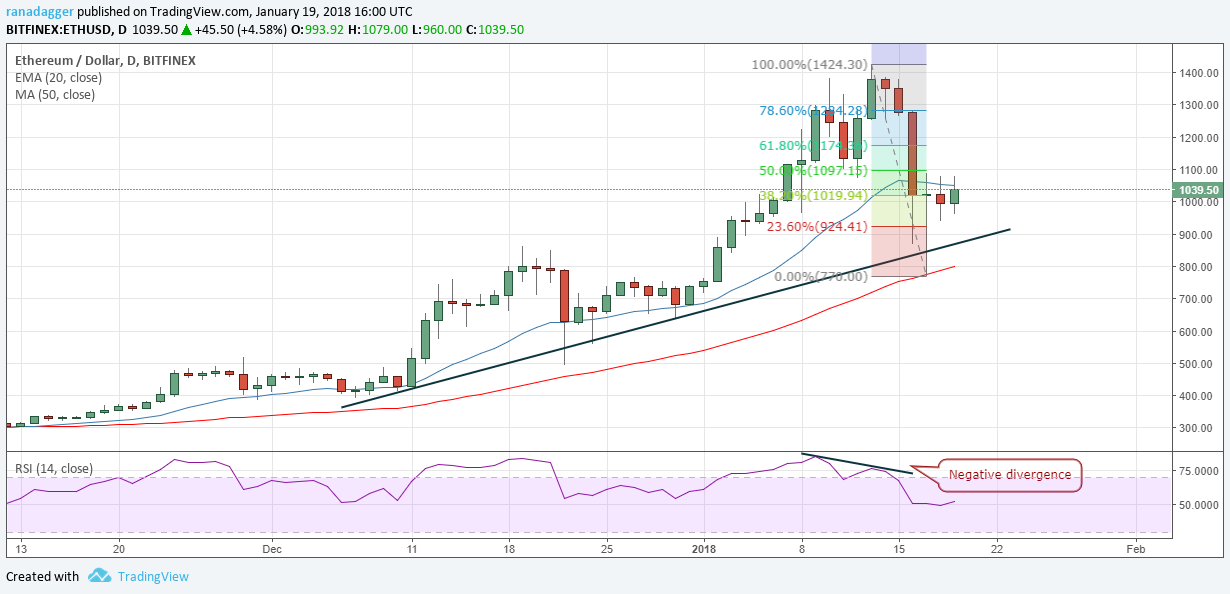
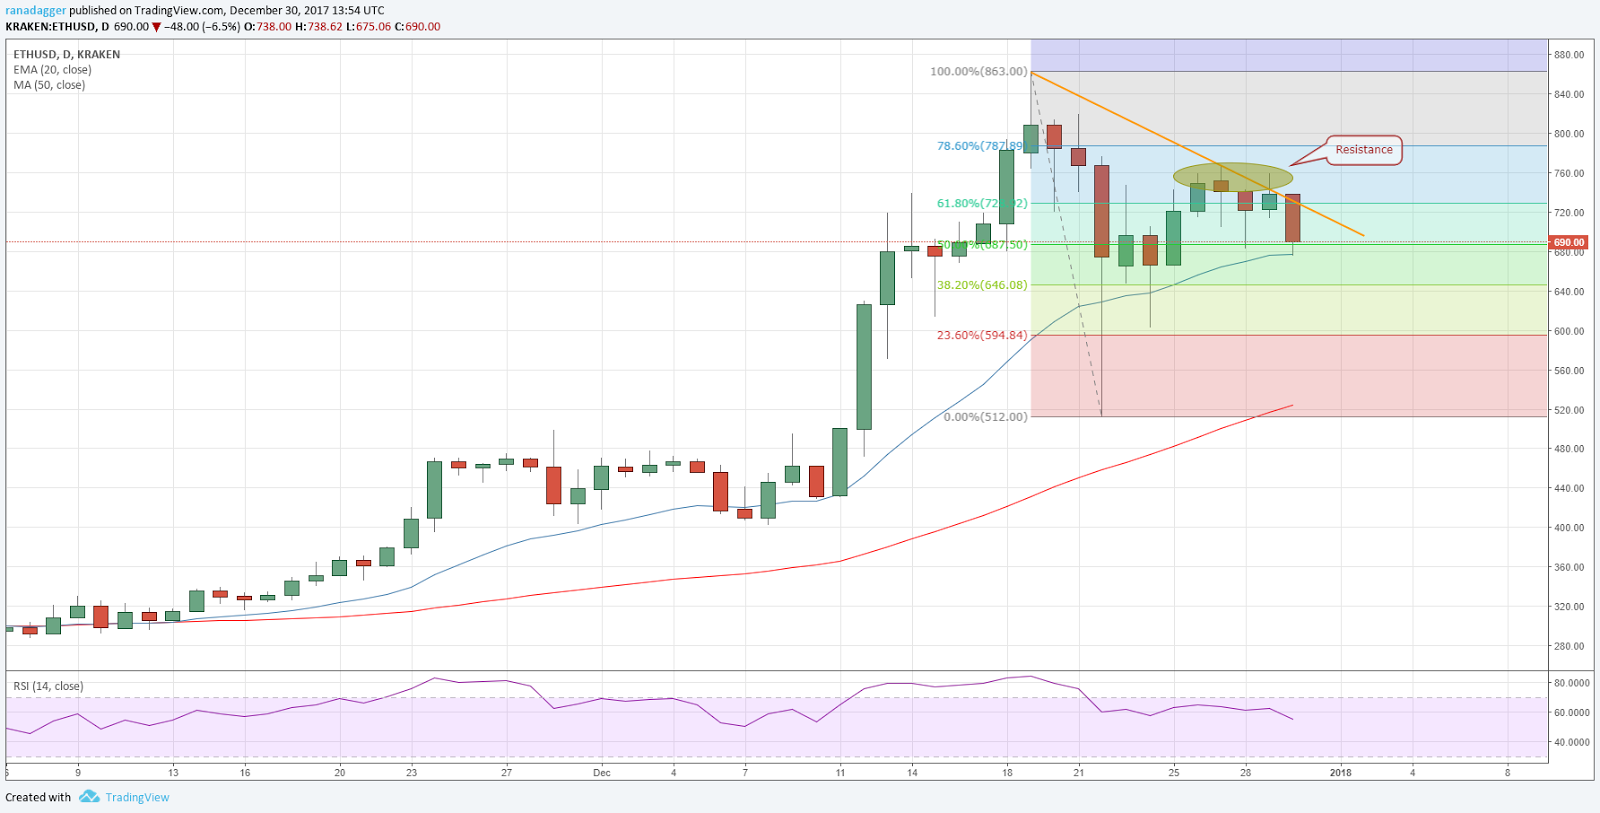
Ethereum broke out of $745 on May 03, which completed a ‘V’ shaped bottom formation. This bullish set up has a pattern target of $1,130, with minor resistances at $900 and at $1,000.

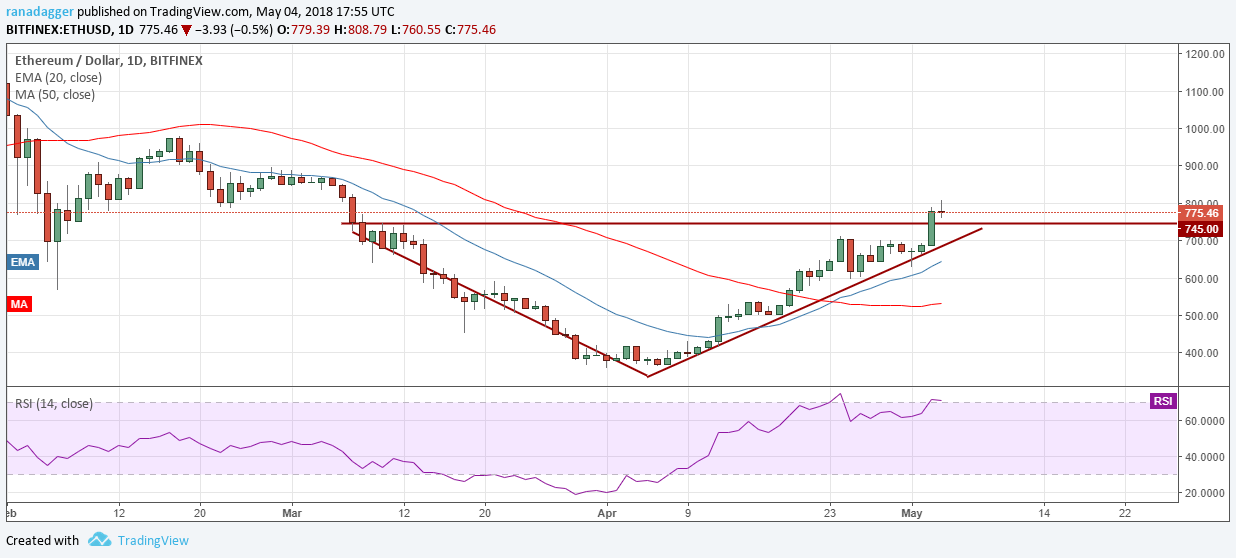
On the downside, $745 will act as the first support. If this breaks, the bulls will defend the trendline close to $700 and the 20-day EMA at $645. The trend will turn bearish or range bound only if the ETH/USD pair sustains below $700.

Traders can wait for a retest of the breakout levels and buy if the $745 level holds. The stop loss can be placed just below the 20-day EMA at $640. Traders should confirm that the levels are holding before entering long positions. No trade should be initiated if the digital currency closes (UTC) below $700.
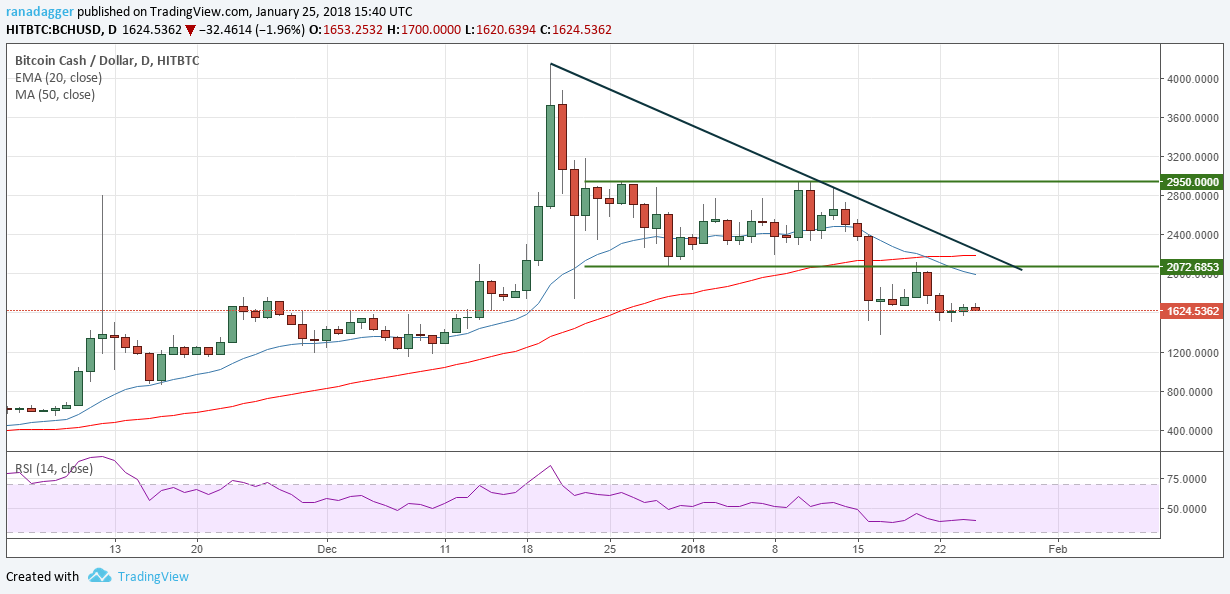
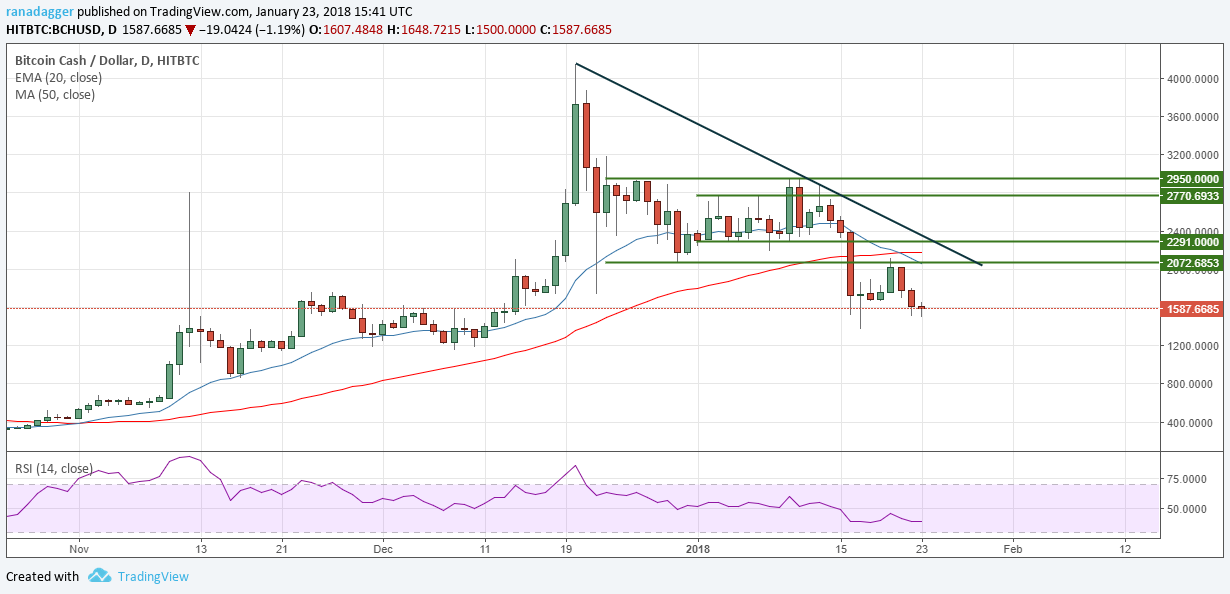
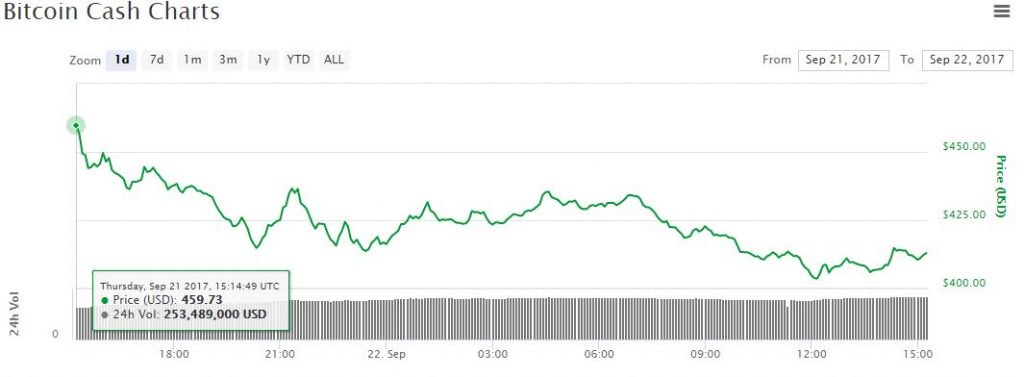
BCH/USD
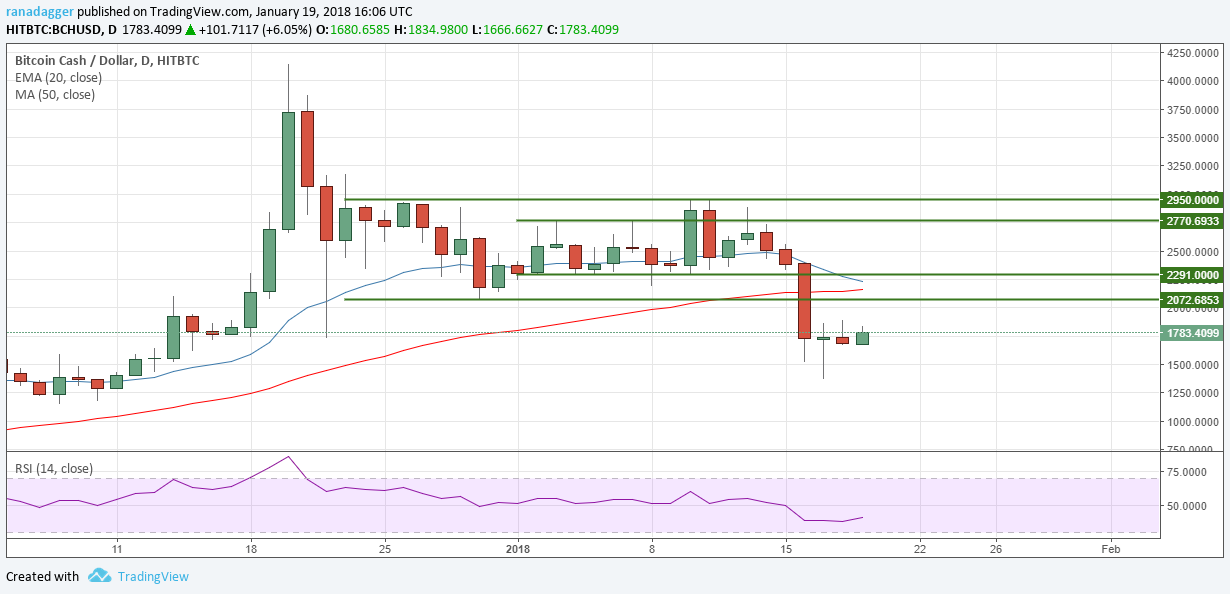
Bitcoin Cash has reached close to the upper end of the range at $1,600, which should act as a stiff resistance. If the price fails to break out of this level, the range-bound action between $1,221 and $1,600 will continue.

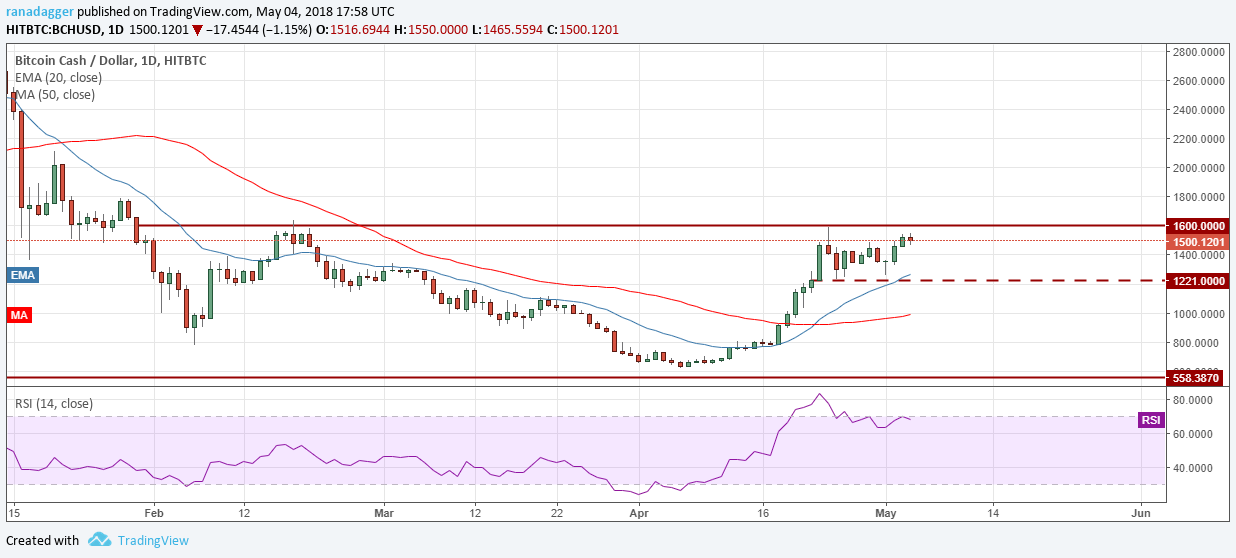
The BCH/USD pair will become positive if the bulls break out and close (UTC) above $1,600. The immediate target objective is a move to $2,000; above it, the rally can extend to $2,400 levels.      

Aggressive traders can buy on a close (UTC) above $1,600 and keep a close stop loss of $1,400. Due to numerous overhead resistances, we consider this as a risky trade, hence, keep the allocation size less than 50 percent of usual.
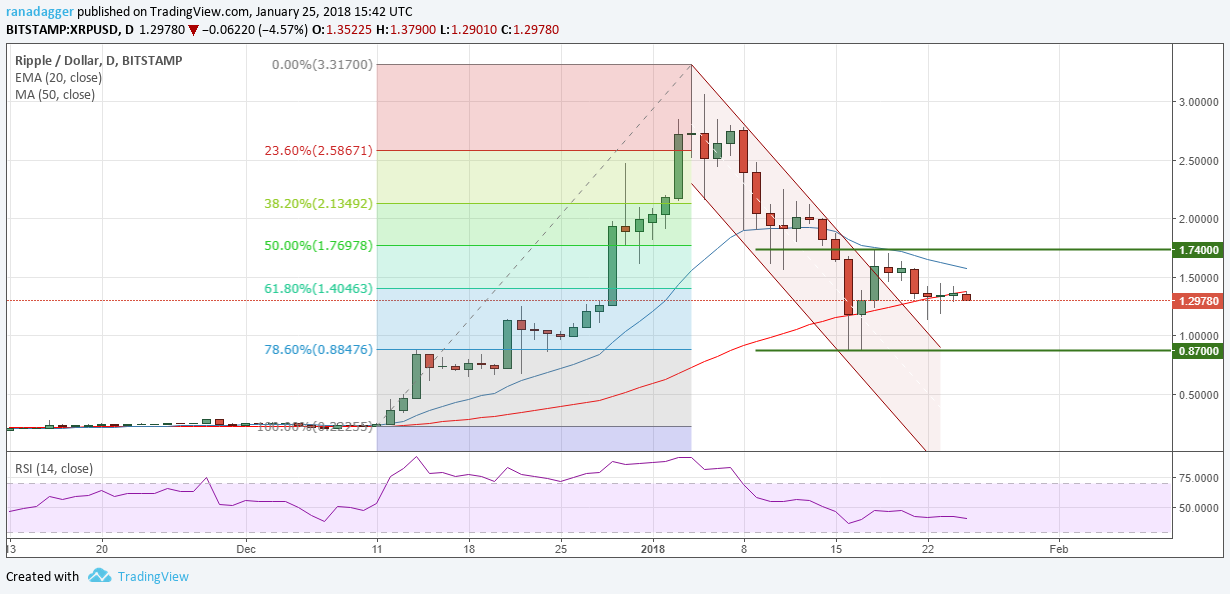
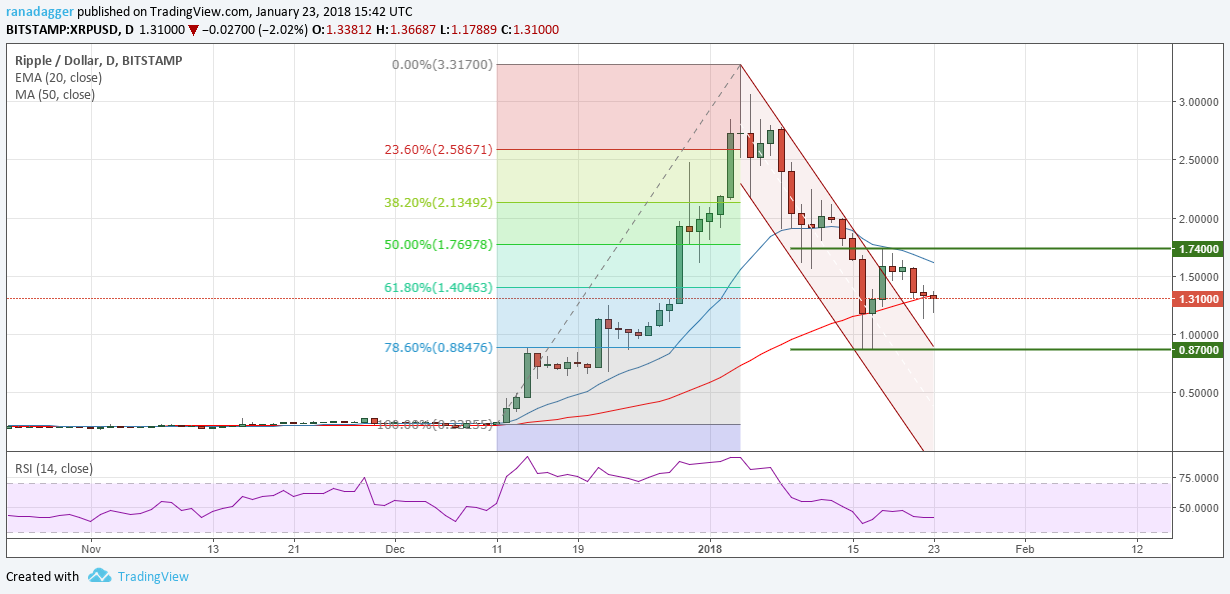
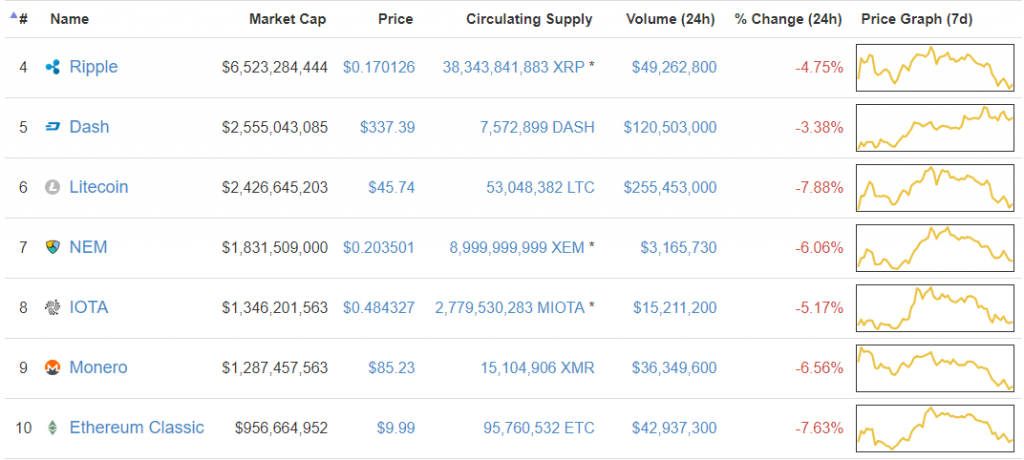
XRP/USD
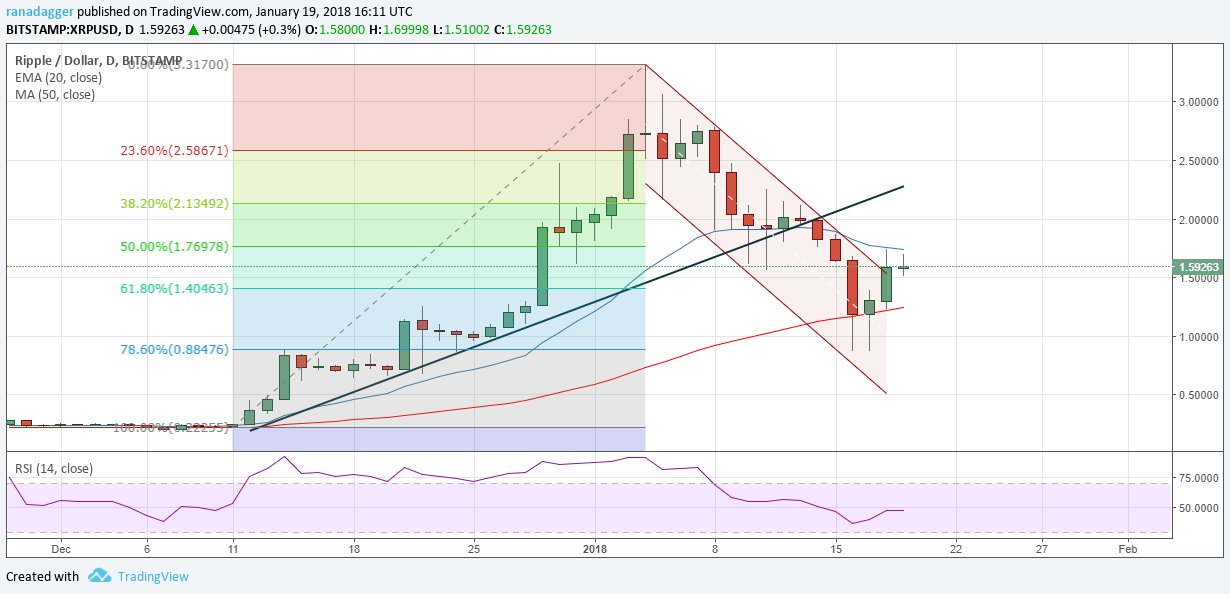
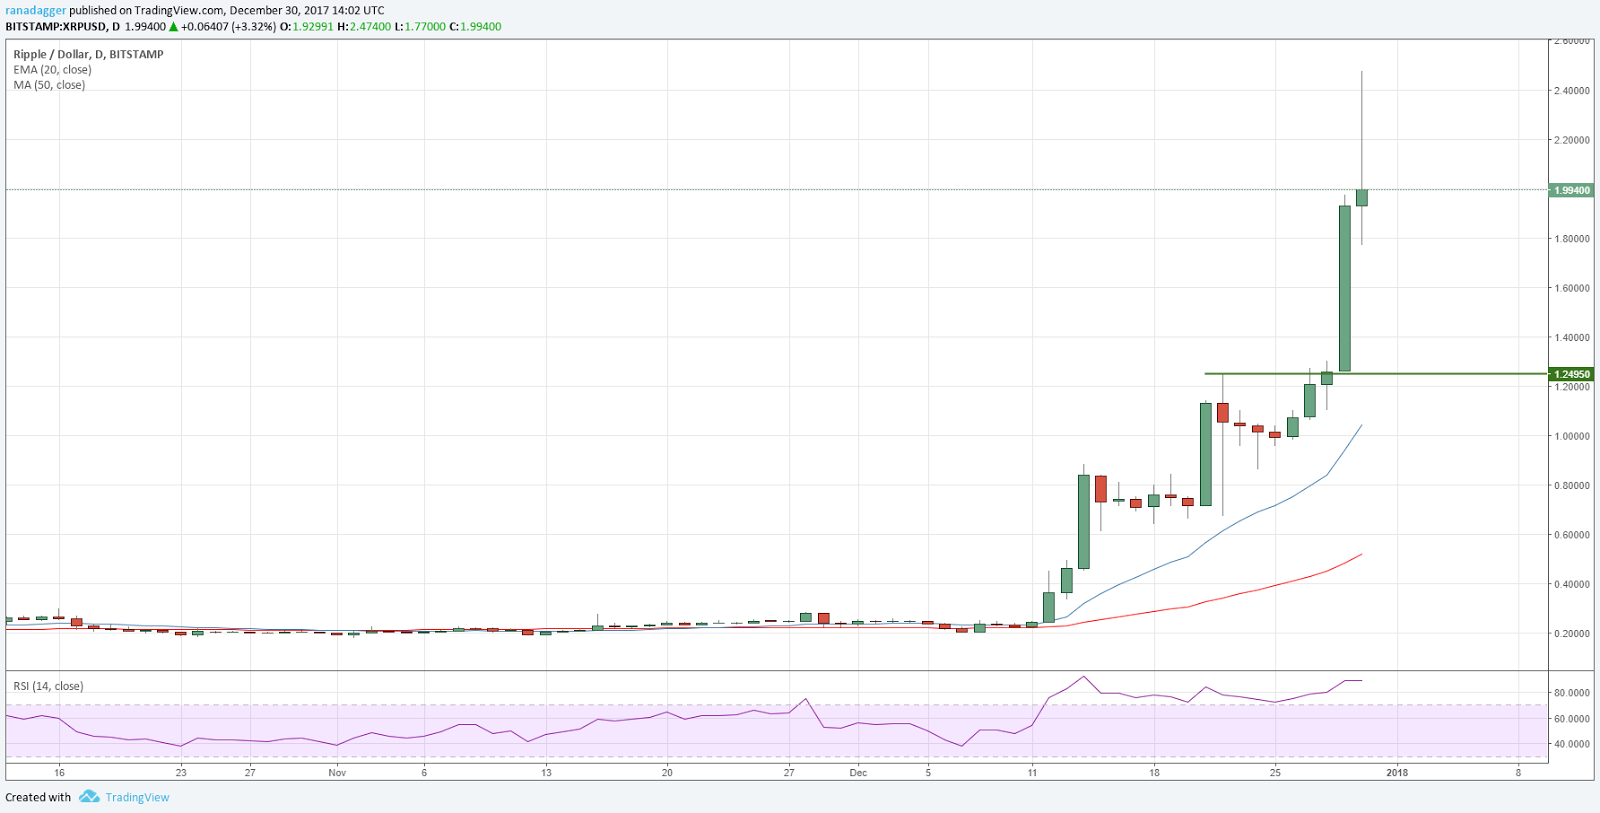
Ripple continues to trade inside the range of $0.76 to $0.93777. A break out of this range will indicate bullishness, and a rally to $1.229 is likely.

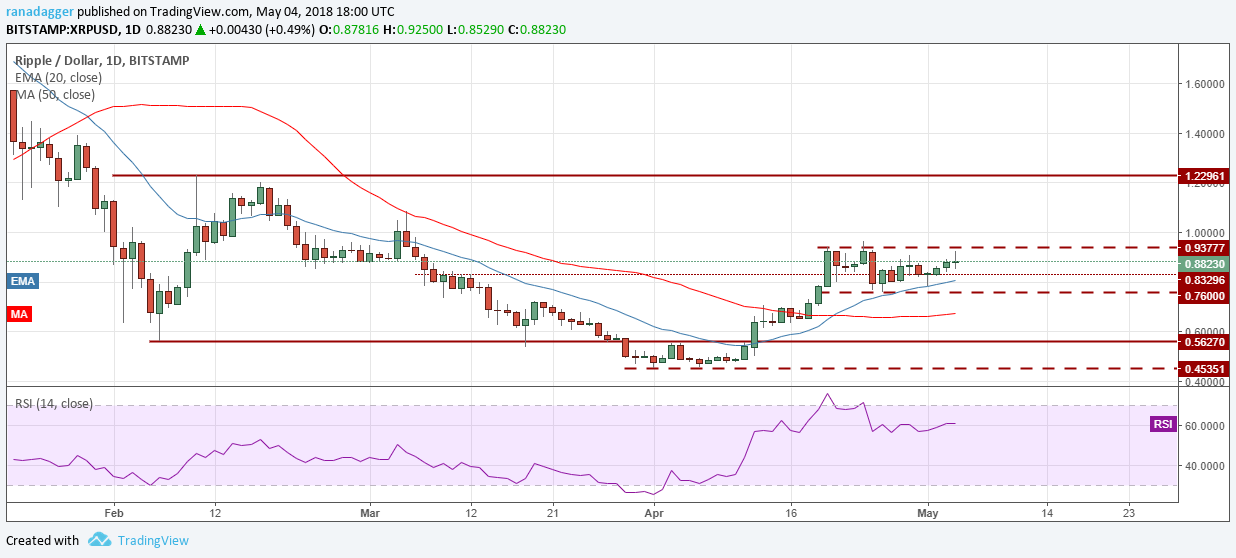
If the XRP/USD pair fails to break out of $0.9377, a few more days of range-bound trading can be expected.

On the downside, support exists at the 20-day EMA and below that at the lower end of the range at $0.76.

The longer the cryptocurrency trades inside the range, the stronger will be the ensuing breakout. We propose waiting for it before entering any long positions.

XLM/USD
Stellar is facing a stiff resistance at the $0.47766719 mark. Though it has failed to cross above this level, it is undergoing a shallow pullback.

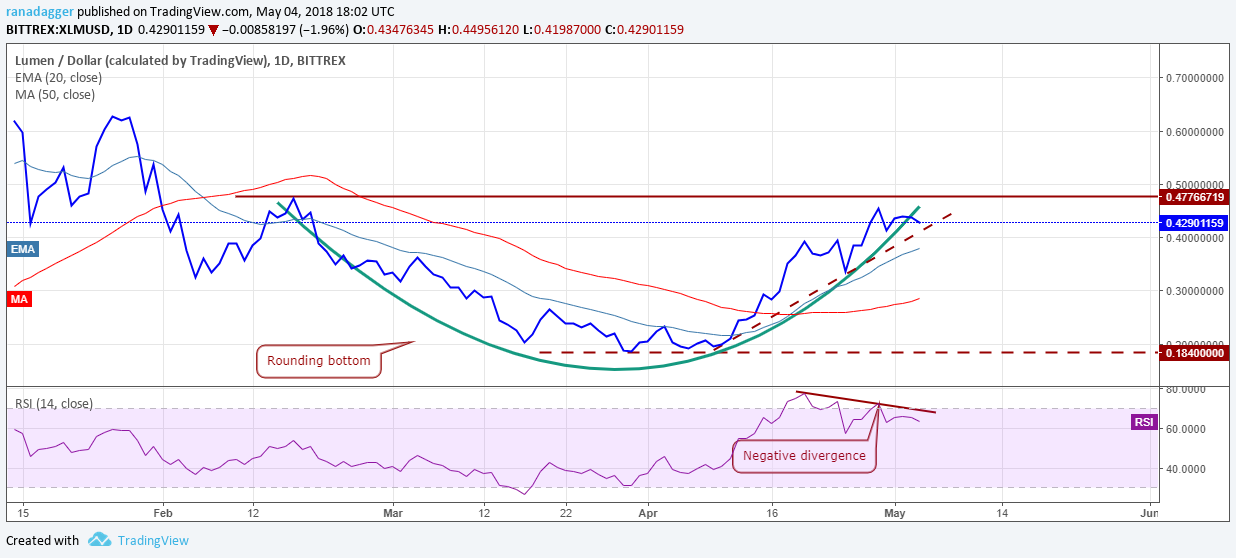
he XLM/USD pair should find support at the trendline, but if it breaks, a slide to $0.335 is probable. The negative divergence on the RSI is a bearish development, hence, traders should wait for a breakout and close (UTC) above the overhead resistance of $0.47766719 before initiating any long positions.
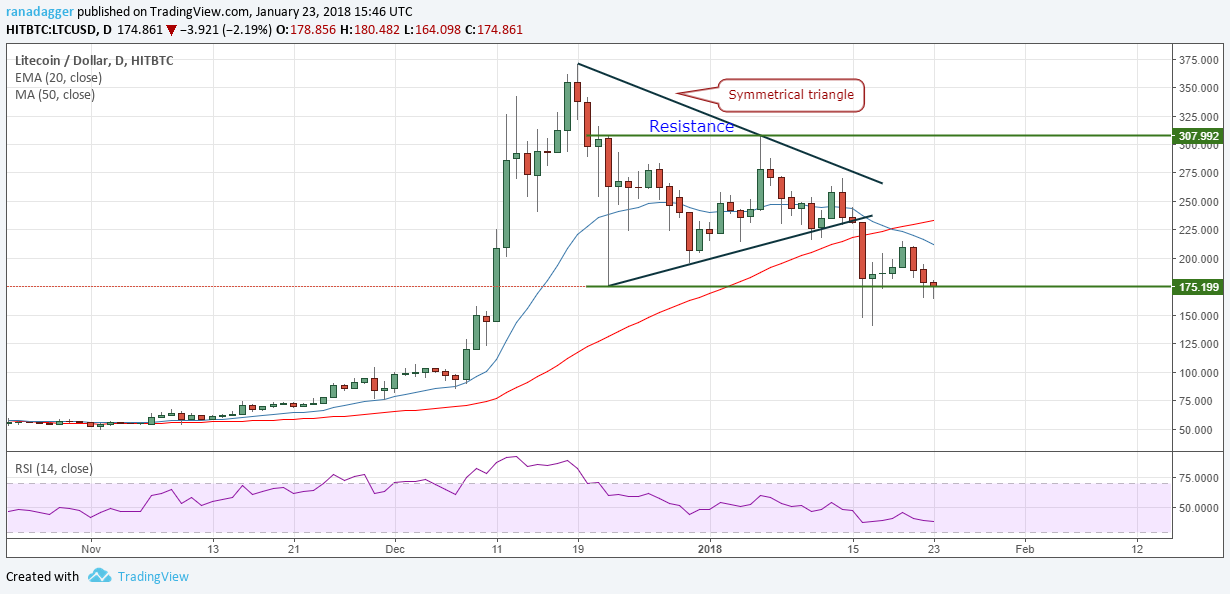
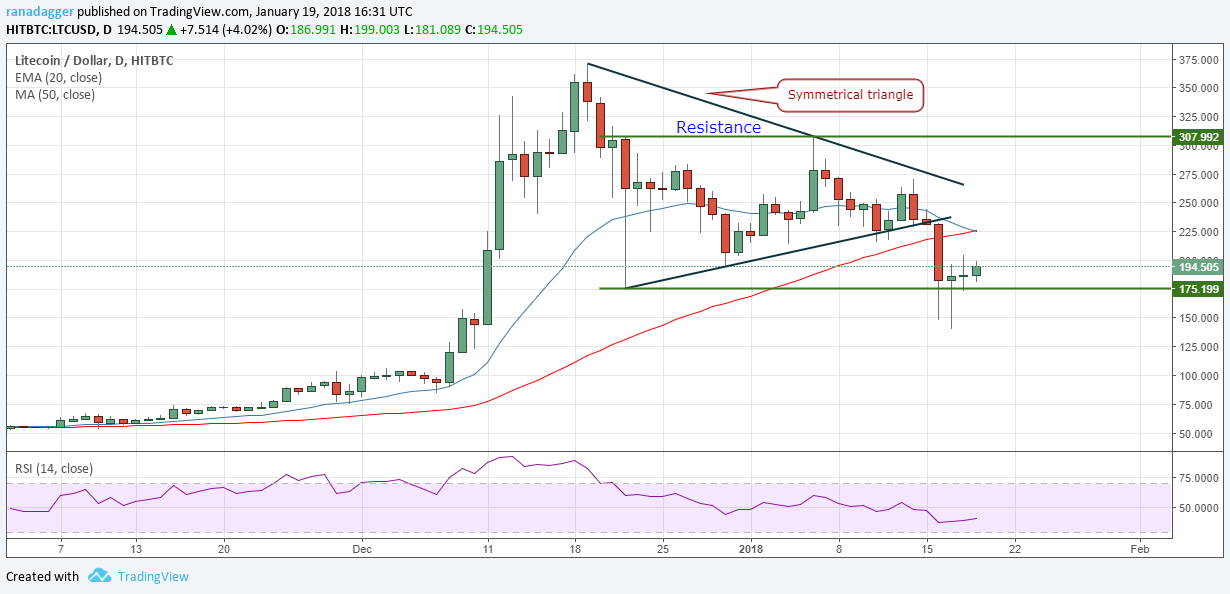
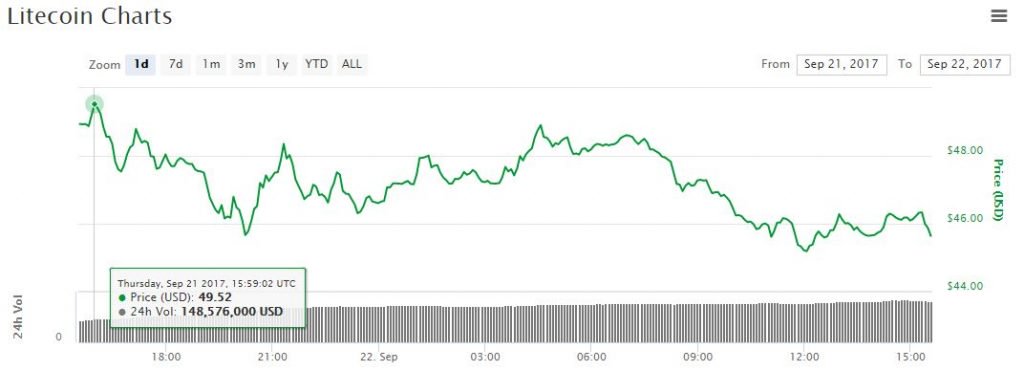
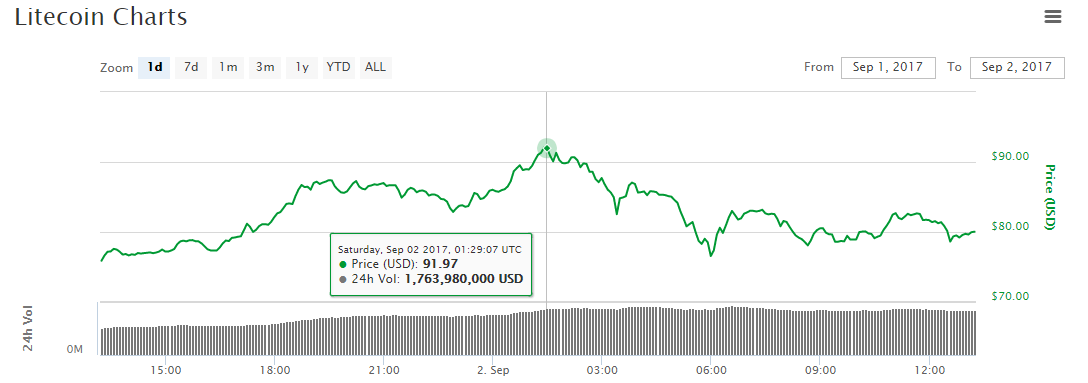
LTC/USD
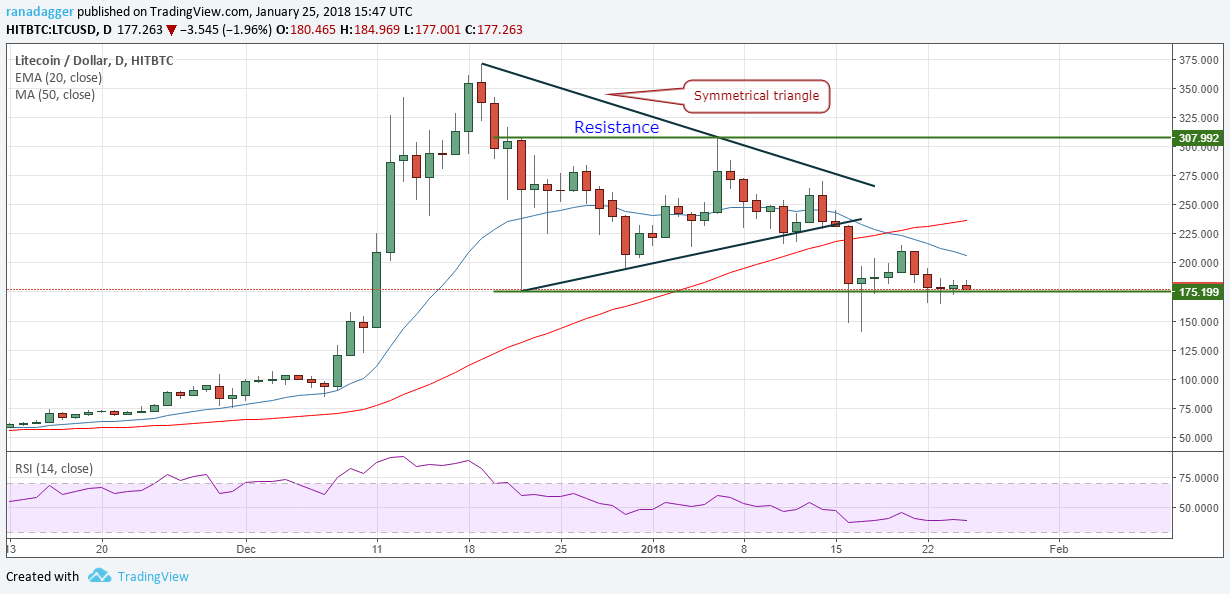
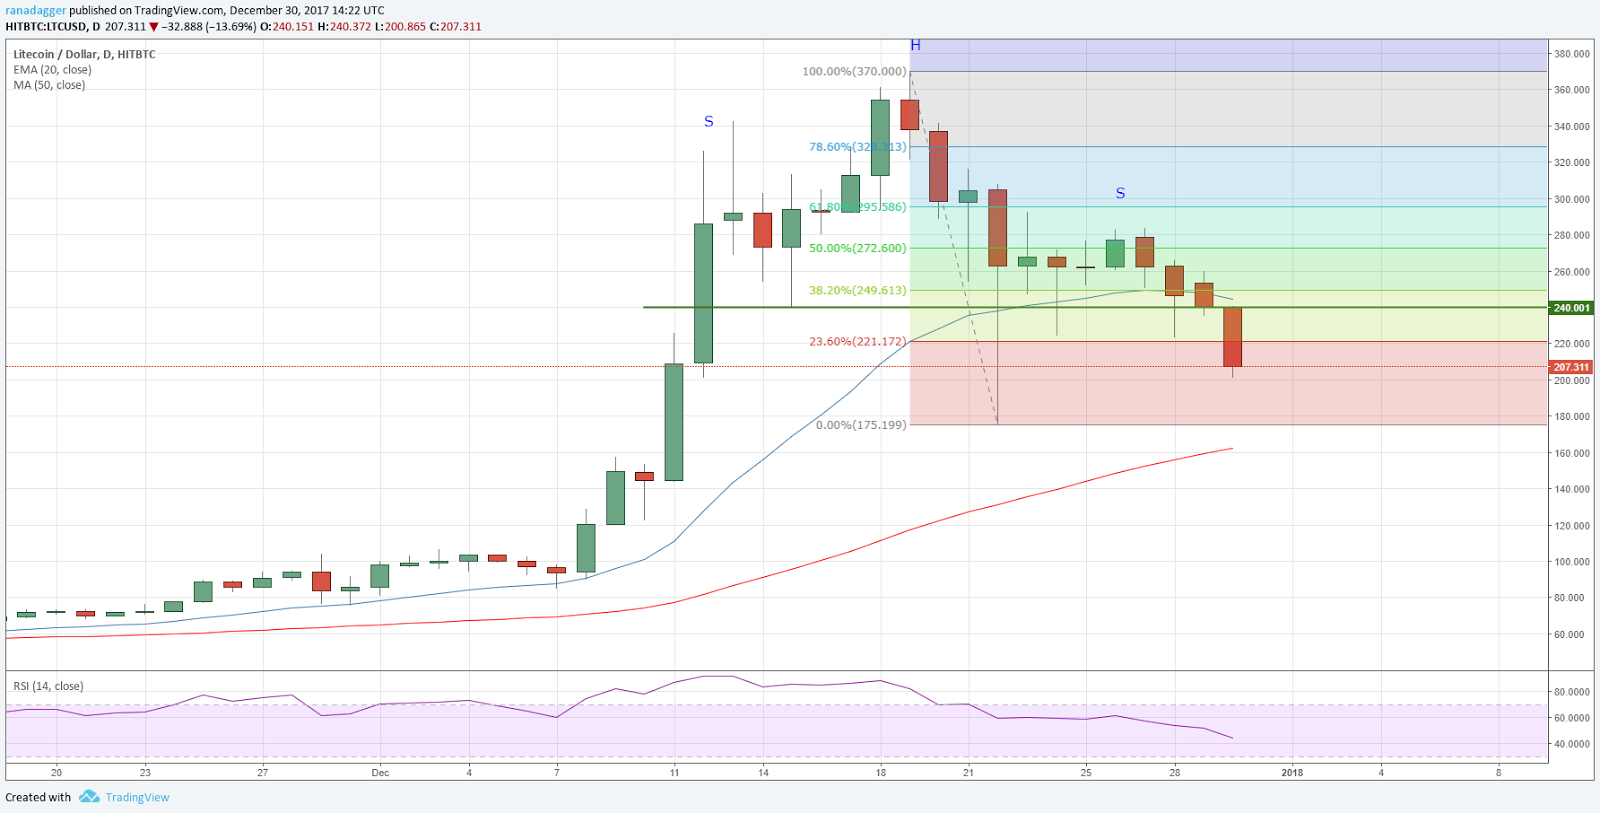
After remaining in a tight range for the past few days, Litecoin finally scaled above the overhead resistance of $160 on May 03. However, it could not reach our target objective of $180, as the bears strongly defended the April 24 highs of $167.399.   

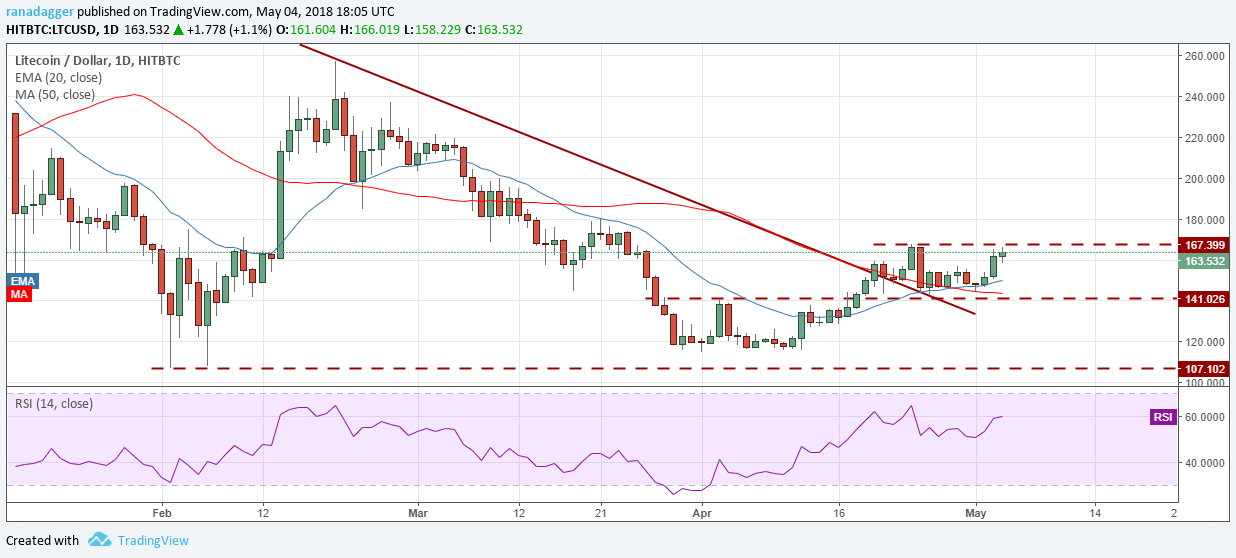
If the LTC/USD pair doesn’t breakout within a couple of days, it will continue to be range bound. On the downside, any break of the $141 levels will be a negative sign.

Therefore, we suggest retaining the stops at $140. We shall trail the stops higher once the digital currency breaks out of $168.
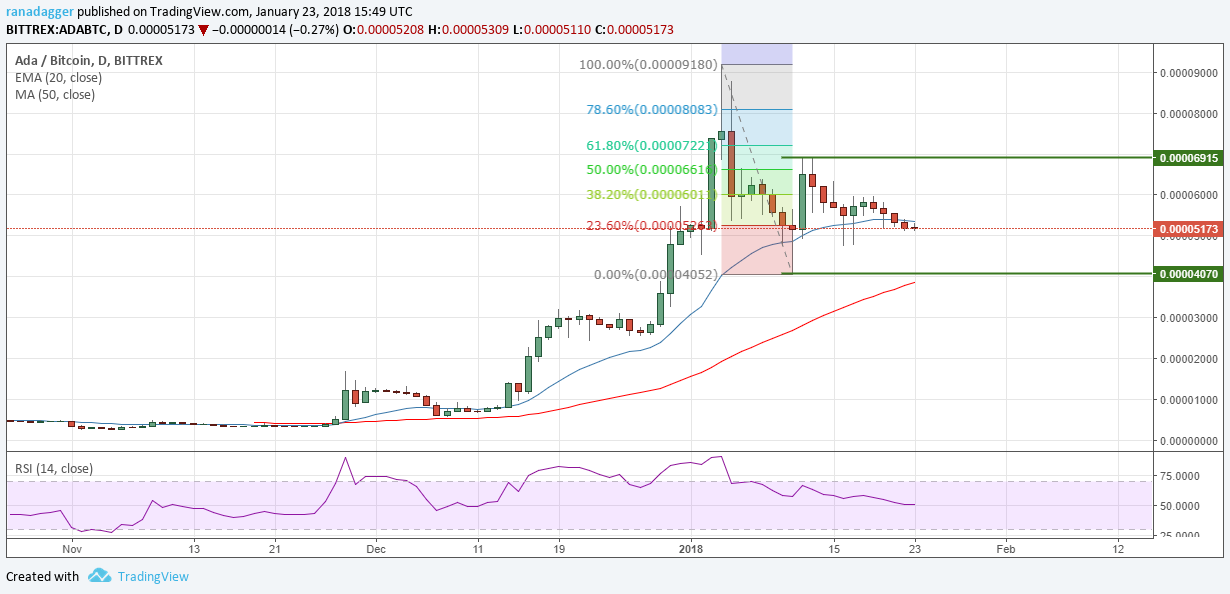
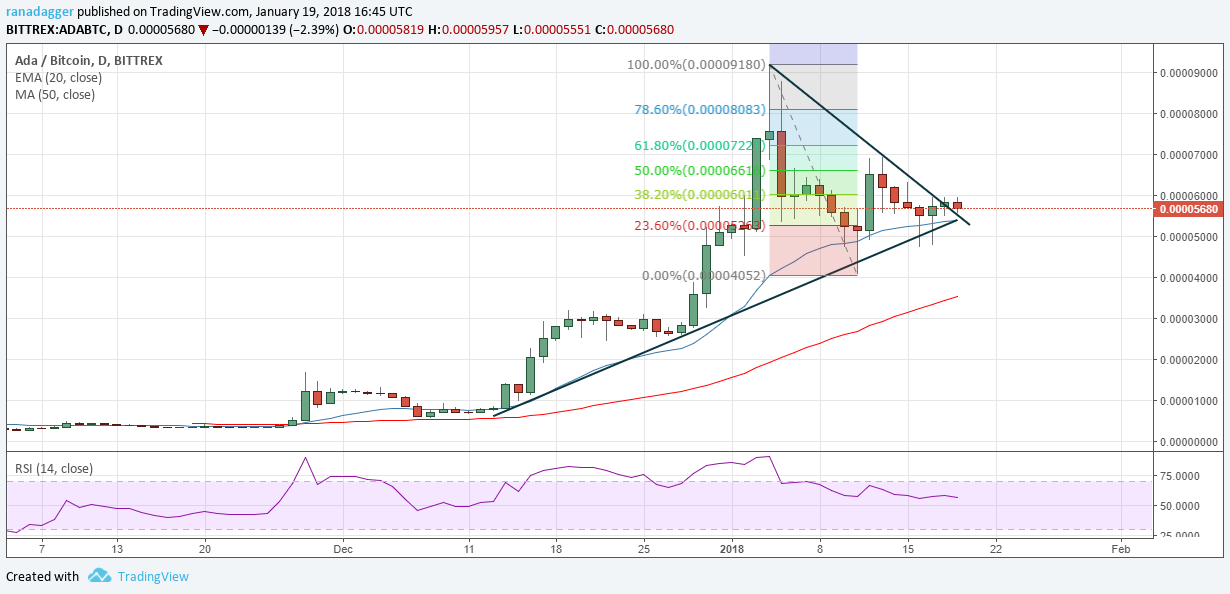
ADA/BTC
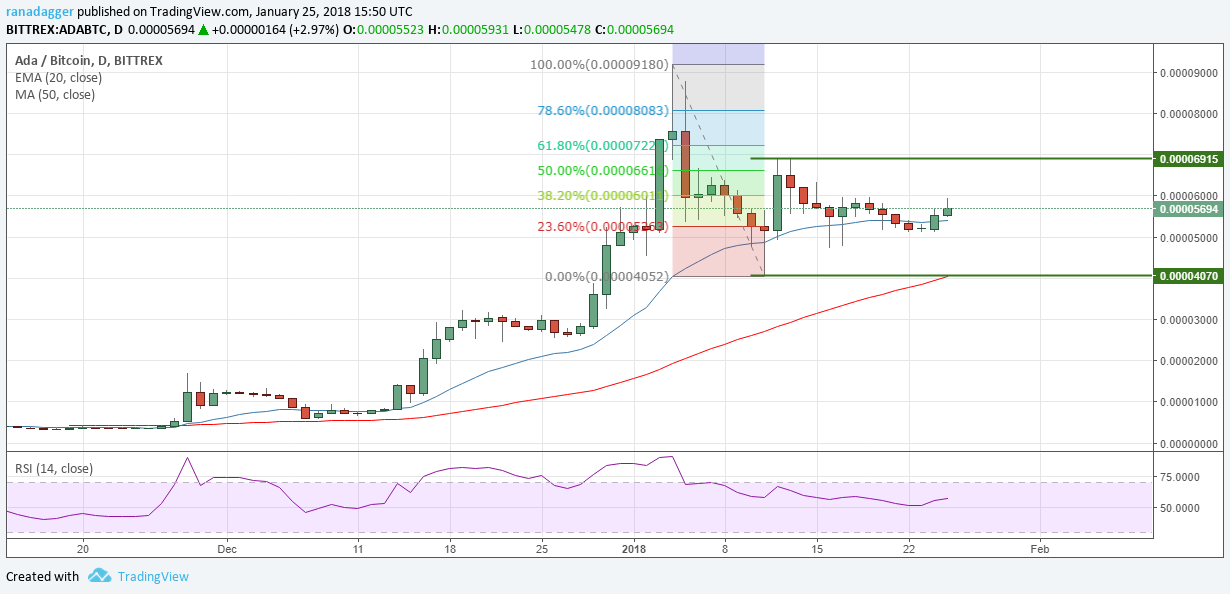
Cardano has failed to extend its uptrend after breaking out of 0.00003445. We had suggested raising the stops higher if the virtual currency crosses above 0.000042 levels, but it did not happen.

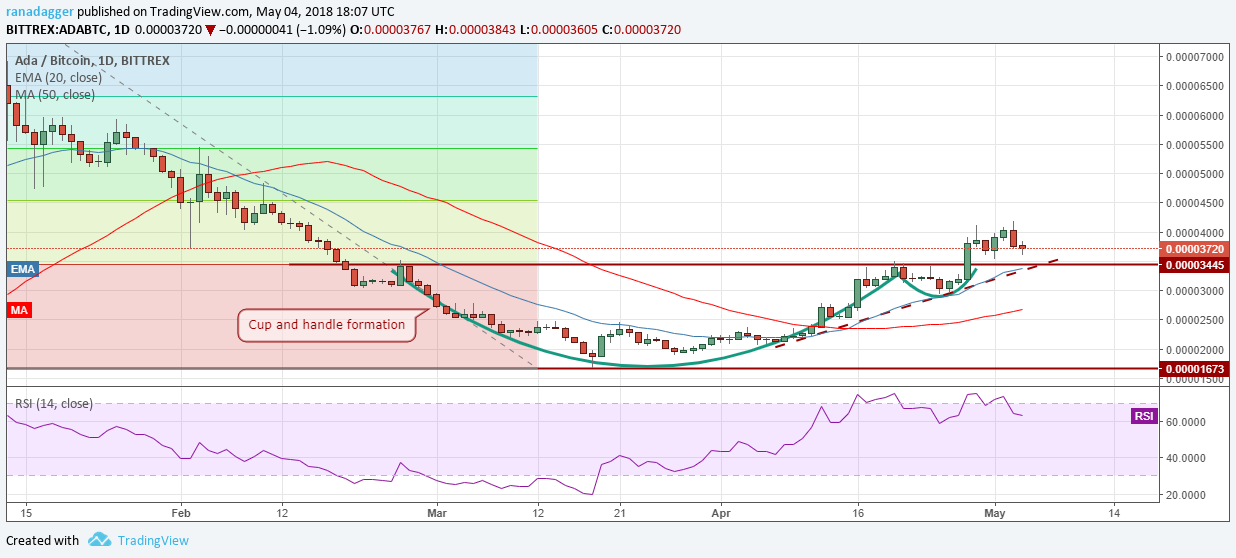
The ADA/BTC pair should now find support at the 0.00003445 levels because there are three major supports close to it.

The first level is the horizontal support, the second one is the trendline support, and the third is the 20-day EMA.

We shall retain the stops at 0.000029 until we see a rally above 0.000042 levels.

Our target objective on the upside is a move to 0.000045, followed by 0.00005217 levels.  
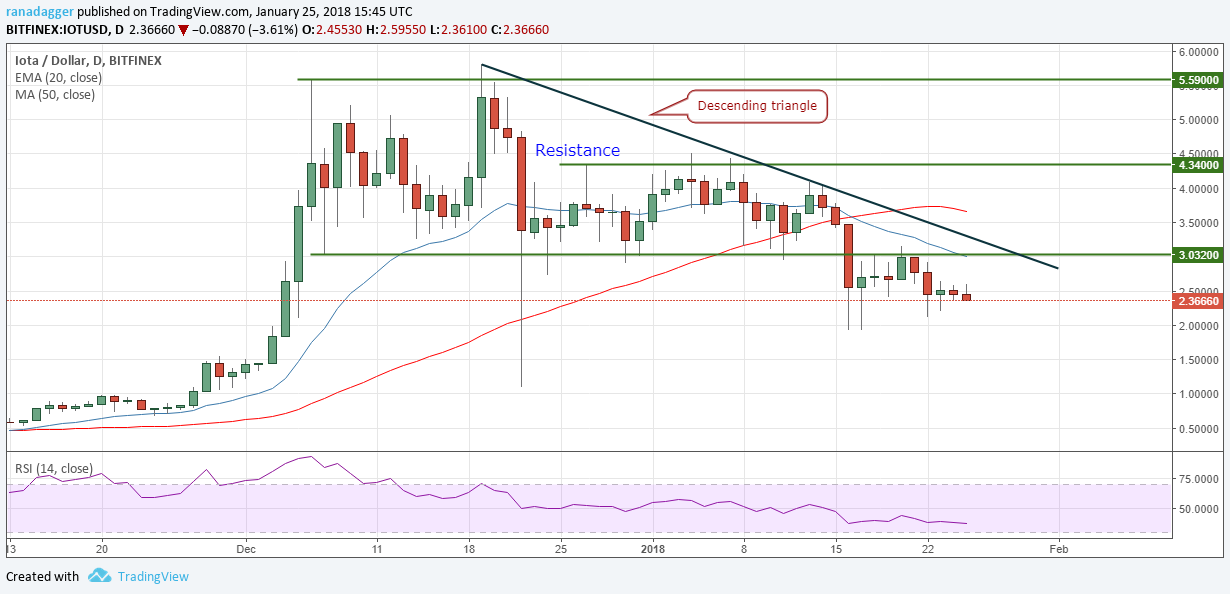
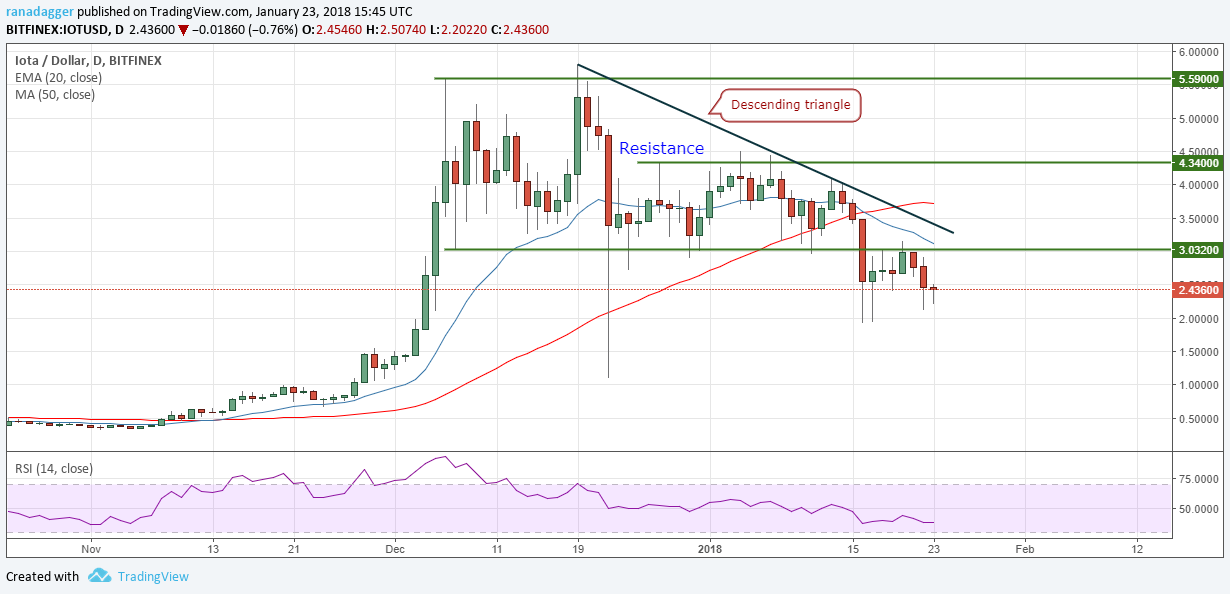
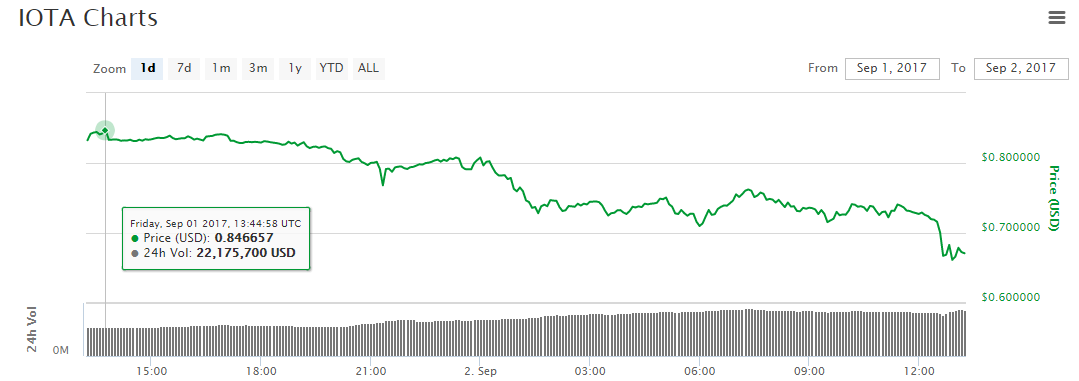
IOTA/USD
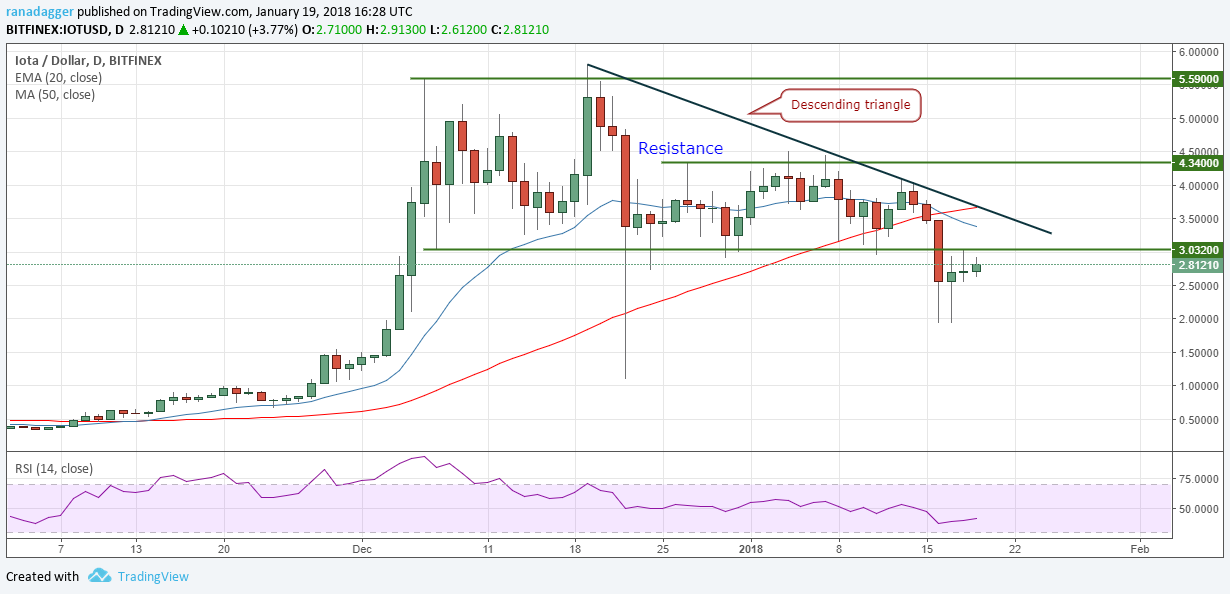
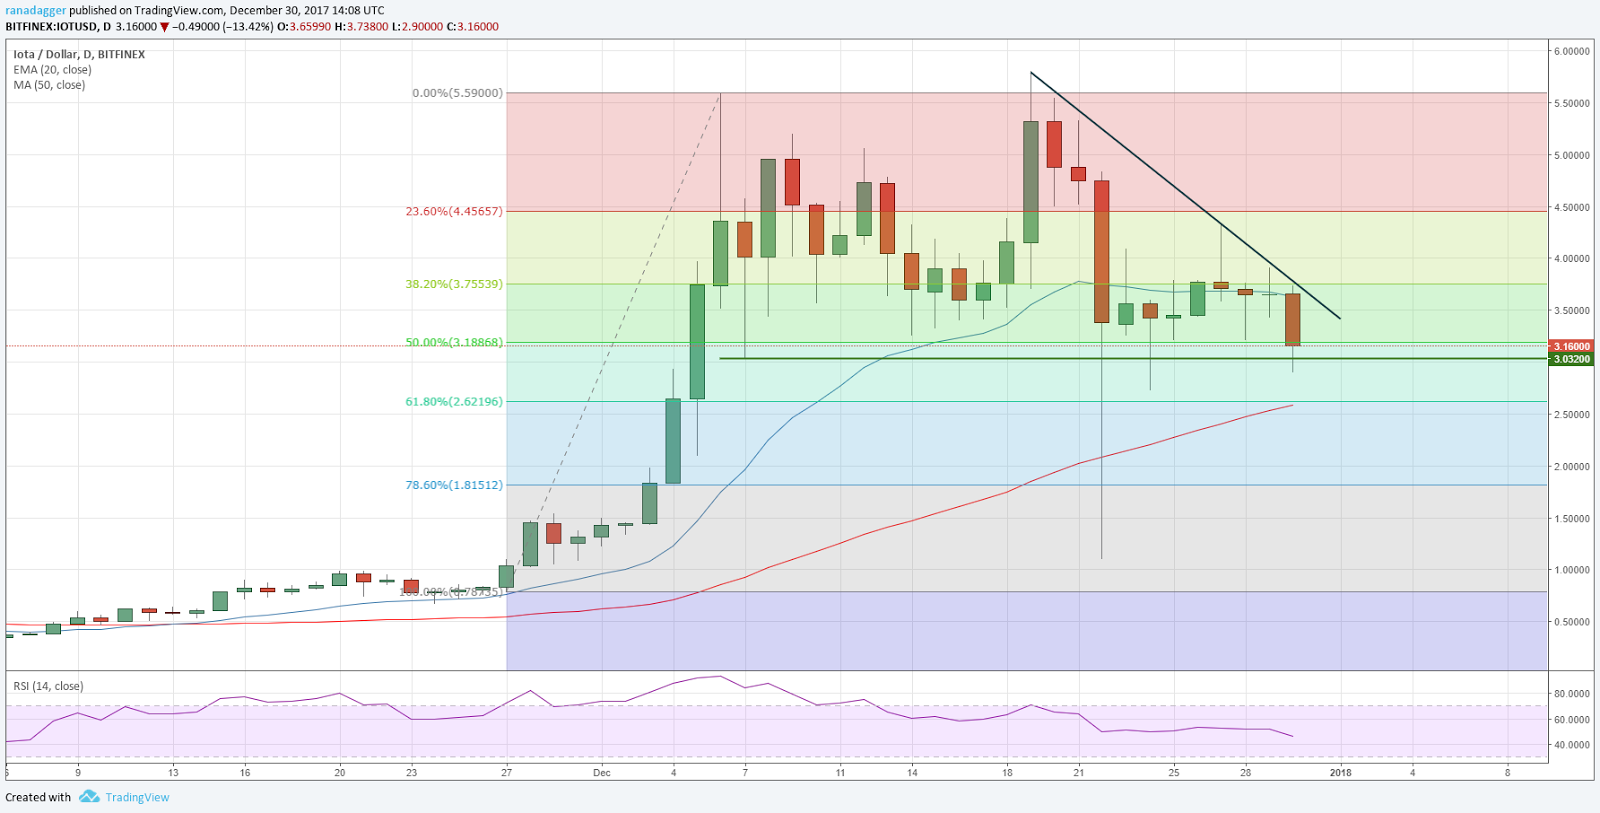
IOTA broke out of the overhead resistance at $2.2117 on May 02 and followed it with another up move on the next day. However, it couldn’t break out of the resistance line of the ascending channel.   

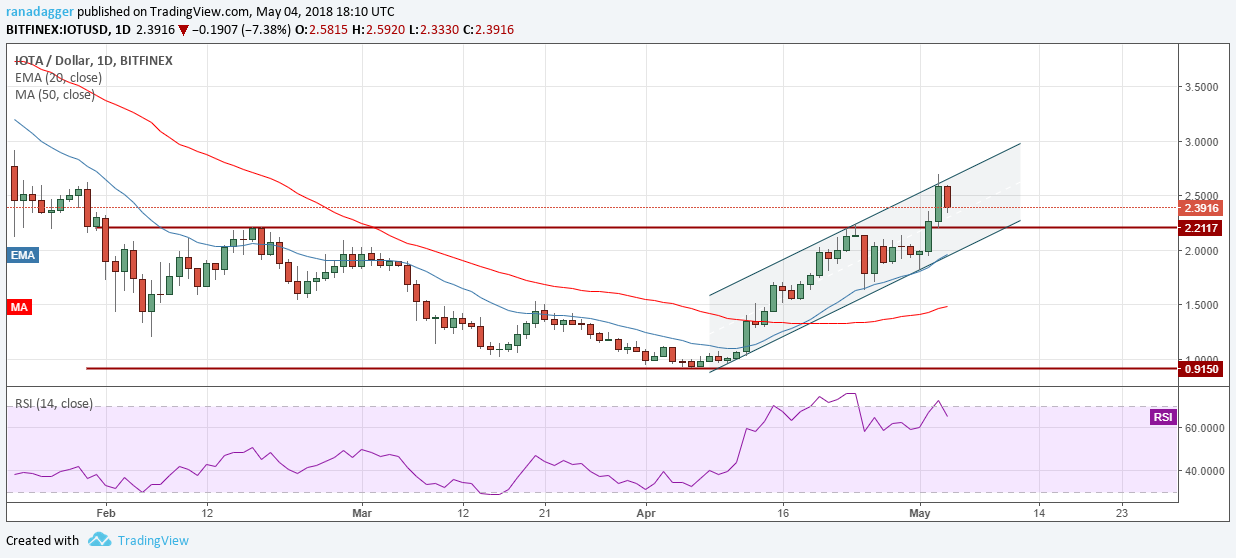
Currently, the IOTA/USD pair is retesting the breakout levels of $2.2117. If the level holds, the bulls will try to break out of the channel and push prices towards $3 and $3.5.

If the digital currency breaks below $2.2117 but finds support close to $2 levels, then the ascending channel will be in play, and a move to the resistance line of the channel can be expected.

Due to the uncertainty, it is better to wait for a couple of days and then buy if the support levels hold. Presently, we don’t have any buy recommendation.

EOS/USD
EOS, after the recent rally, has entered into a period of consolidation. Though it found support at the 38.2 percent Fibonacci retracement level on May 01, it could not scale the $20 levels in the ensuing up move.

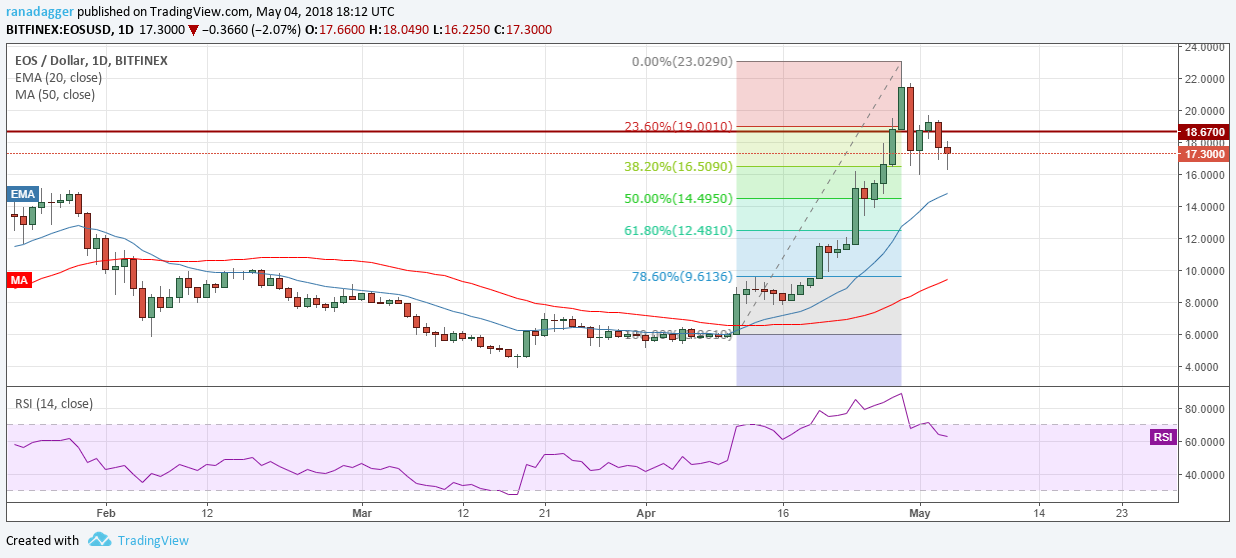
On the downside, $16 should act as a strong support, below which, the EOS/USD pair can slide to the 20-day EMA.

We shall wait for the consolidation to play out and a new buy setup to form before recommending any fresh long positions.

By  Rakesh Upadhyay

Alan Zibluk – Markethive Founding Member

Bitcoin Drops 20% But Wasn’t Week’s Big Crypto Price Loser

Bitcoin Drops 20% But Wasn't Week's Big Crypto Price Loser

Bitcoin Drops 20% But Wasn't Week's Big Crypto Price Loser

If February was bad for the crypto market, March hasn't fared better.

Bitcoin's (BTC) repeated failure to beat inverse head-and-shoulders neckline resistance saw bears come in full force, pushing prices to a one-month low of $8,371 Friday. As of writing, the world's largest cryptocurrency by market capitalization is trading at $8,970, according to CoinDesk's Bitcoin Price Index.

But the 28 percent drop from BTC's March 5 high of $11,660 had broader implications, pushing the market capitalization below $350 billion for the first time since Feb. 14.

The sell-off in BTC seems to have roiled broader markets, a trend evident by the fact the top 25 cryptos by total value are all reporting weekly losses
As such, while bitcoin has depreciated by 20.98 percent week-on-week, it's notably not the top loser of the week, with TRON, ICON and IOTA ranking higher on bigger losses.

Weekly performance: -42.65 percent

All-time high: $34.40

Closing price on March 2: $16.20

Current market price: $9.29

Rank as per market capitalization: 22

Having topped out at $17.38 on March 1, nano prices fell below $10 today for the first time since Feb. 23 this week.

So, despite positive news, such as a thumbs up from influential litecoin founder Charlie Lee, the endorsement failed to keep the nano bid amid a broader market sell-off.

As of writing, the cryptocurrency is seen changing hands at 0.0011 BTC (about $10) on Binance. The recovery from the intraday low of BTC 0.001008 (roughly $9) in the wake of oversold conditions (as shown by the relative strength index) has neutralized the immediate bearish outlook.

However, only an upside break of the descending channel would signal a bearish-to-bullish trend change.

Weekly performance: -38.51 percent

All-time high: $0.30

Closing price on March 2: $0.05

Current market price: $0.03

Rank as per market capitalization: 15

After rocketing to records earlier this year, TRON showed signs it hasn't quite been able to recover from the backlash of severe criticism.

This week, TRON even reached a strategic partnership with Trip.io to advance blockchain applications in the travel industry, and announced a strategic cooperation with BitGuild (a blockchain game platform)

Elsewhere, TRON Founder Justin Sun went so far as to reveal plans to accelerate the launch of main net.

Still, the positive news flow failed to put a floor under TRON prices. TRX/USD fell to $0.03 yesterday – its lowest level since Feb. 8.

Weekly performance: -38 percent

All-time high: $12.04

Closing price on March 2: $3.71

Current market price: $2.30

Rank as per market capitalization: 24

February's top loser hasn't had a good start this month

Prices for ICON's ICX token fell to $2.16 on Binance – the lowest level since Dec. 22, with a series of lower highs and lower lows on the daily chart indicating the bears are in control of the market.

However, short-term oversold conditions as shown by the relative strength index could yield a minor corrective rally.


Author Omkar Godbole Mar 9, 2018 at 21:52 UTC


Posted by David Ogden Entrepreneur
David Ogden Cryptocurrency Entrepreneur

Alan Zibluk – Markethive Founding Member

Bitcoin, Ethereum, Bitcoin Cash, Ripple, IOTA, Litecoin, NEM, Cardano – Price Analysis, Jan. 25

Bitcoin, Ethereum, Bitcoin Cash, Ripple, IOTA, Litecoin, NEM, Cardano -  Price Analysis, Jan. 25

Bitcoin, Ethereum, Bitcoin Cash, Ripple, IOTA, Litecoin, NEM, Cardano – Price Analysis, Jan. 25

The massive upwards movement in cryptocurrencies over 2017 has not gone unnoticed. The participants at the World Economic Forum (WEF) in Davos are being questioned about cryptocurrencies and Cointelegraph has been one of the main voices representing the fraternity.

The traditional investors are still not willing to accept the rising clout of the cryptocurrencies and are pushing for tighter regulation. Only recently, Nordea Bank banned its employees from owning Bitcoin by Feb. 28. However, this move is facing strong opposition from the large unions.

Even the fears of a cryptocurrency ban by South Korea gathered a massive petition opposing the move. Finally, the Korean government only banned the traders from using anonymous bank accounts for cryptocurrency trading.

The classical investors and regulators fail to understand that these kinds of bans are unlikely to dent the popularity of the cryptocurrencies.


BTC/USD

Bitcoin is currently in no man’s land. It is facing resistance at the down trendline one. If the bulls succeed in breaking out of this resistance, we can expect a rally towards the down trendline two. Aggressive traders can trade this pullback.

Others should wait for a confirmation of a bottom formation because, if the bulls fail to sustain above the down trendline one, the likelihood of $10,000 levels breakdown increases.

Unlike the previous falls, this time, the BTC/USD pair is struggling to hold on to higher levels. With the price quoting below both the 20-day EMA and the 50-day EMA, the trend remains down to range bound.

The downtrend will reassert itself if the price breaks down to $10,000 levels. So, the swing traders should wait and watch for the next few days for the trend to change from down to up before initiating any long positions.


ETH/USD

Ethereum is in a pullback in an uptrend because it is still quoting above both the 20-day EMA and the 50-day SMA. Additionally, it has successfully held on to the uptrend line, which is another positive sign.

But the 20-day EMA has flattened out, which points to a range bound trading action for the next few days. The support of the range is likely to be at $900 levels, whereas, the resistance will be at $1,160 levels.

The ETH/USD pair will become negative only after it breaks down of the trendline and the 50-day SMA, which is at $845.

Long positions for the medium-term can be initiated on dips to $1,000 levels, with a stop loss at $840. We believe that if the 50-day SMA holds, the cryptocurrency will attempt to resume its uptrend and rally to the highs. This is a risky trade, hence, please keep the position size small.


BCH/USD

The traders, both the bulls and the bears, are not taking any keen interest in Bitcoin Cash. As a result, it has been trading in a small range since Jan. 23.

Support on the downside exists at the Jan. 17 low, $1,364.9657. On the upside, as the moving averages have completed bearish crossover, the 20-day EMA is likely to act as a resistance. Additionally, the $2,072 levels and the downtrend line will also act as a strong overhead resistance.

We don’t find any tradable setup on the BCH/USD pair.


XRP/USD

Ripple has formed a doji candlestick pattern on both Jan. 23 and Jan. 24. Even the price action currently points to a very small range day.

As forecast in our previous analysis, the XRP/USD pair is likely to remain range bound between $0.87 and $1.74. A trading opportunity will pop up only if the supports of the range hold or if the cryptocurrency breaks out of the overhead resistance. We should wait until then.


IOTA/USD

IOTA’s range has been shrinking for the past two days. It has formed successive inside day candlestick patterns on Jan. 23 and Jan. 24. Today, it is trying to resume the downtrend.

On the downside, support exists at $1.9232 levels. If this breaks, the IOTA/USD pair can extend its losses to the Dec. 22 low of $1.1.

The first signs of a recovery will be seen once the price breaks out of $3.032 and the down trendline of the descending triangle.

If the support and the overhead resistance levels hold, we may see a few days of range bound action.


LTC/USD

Litecoin has held on to the critical support level of $175.199. However, the bounce doesn’t have any strength, which shows a lack of interest in buyers.

If the bears succeed in breaking down the supports, a fall to $140.001 is likely.

On the other hand, the first signs of a recovery will be on a breakout above $215 levels.

Aggressive traders can buy the LTC/USD pair at $187, which is just above the high of past couple of days. The stop loss for the trade can be kept at $163 and the target objective is $215.

However, this is a very risky trade, hence, please place it only with less than 50 percent of the usual allocation.


XEM/USD

NEM has held on to the 0.86 levels for the past few days, but the bulls are unable to push prices above the down trendline.

This is likely to lead to another attempt to break down of $0.86 within a couple of days. If the bears succeed, a fall to the Jan. 16 lows of $0.55134 is likely. The 20-day EMA has turned down and is likely to complete a bearish crossover if the support breaks.

We don’t find any bullish setups on the XEM/USD pair with price trading below the trendline and both the moving averages. A change in trend will be signaled once it rallies above $1.21.


ADA/BTC

Cardano is again attempting to break out of the 0.00006 levels. If successful, it is likely to rally to the overhead resistance at 0.00006915. A very short-term trader can buy at 0.00006 with a stop loss of 0.00005. This is a risky trade, hence, please attempt it with less than 50 percent of the usual position size.

Swing traders should wait for a breakout of the 0.00006915 levels to initiate any long positions. We believe that unless the sentiment turns bullish for the cryptocurrencies, the ADA/BTC pair will find it difficult to breakout of the overhead resistance and may drift down to 0.000047 to 0.000049 levels again, which can be a good level to initiate long positions.


Author Rakesh Upadhyay


Posted By David Ogden  Entrepreneur

Alan Zibluk – Markethive Founding Member

Bitcoin, Ethereum, Bitcoin Cash, Ripple, IOTA, Litecoin, NEM, Cardano – Price Analysis, Jan. 23

Bitcoin, Ethereum, Bitcoin Cash, Ripple, IOTA, Litecoin, NEM, Cardano -  Price Analysis, Jan. 23

Bitcoin, Ethereum, Bitcoin Cash, Ripple, IOTA, Litecoin, NEM, Cardano – Price Analysis, Jan. 23

When the markets are bullish, a lot of traders only focus on high target levels. This leads to a left out feeling among the ones who have missed out on the rally, and they rush to buy at elevated levels. This results in a huge loss of capital to the uninformed traders.

The opposite works when the market falls. One starts to hear bearish voices with the analysts forecasting apocalypse and novice traders get scared and dump their holdings. They buy when they should be selling and sell when they should be buying.

Hence, it is always better to take these forecasts with a pinch of salt. We, therefore, avoid giving unrealistic target levels to our readers and try to keep them on the right side of the trade.
 

BTC/USD

In our previous analysis, we had predicted that Bitcoin would turn down from the $13,202 levels and that is what happened. The cryptocurrency topped out at $12,988.89 on Jan. 20. It is currently retesting the critical support zone of $10,704.99 to $9,300.

For the past two days, the bulls are defending the $10,000 levels. If this level holds, we may see another attempt to pull back. The trend will turn positive in the short-term only when the BTC/USD pair breaks out of the down trendline 1.

This trade should be taken with only 50 percent allocation because on the way up, Bitcoin will face resistance at the neckline of the head and shoulders pattern and at the down trendline 2.

On the downside, a break of $10,000 is likely to hurt sentiment, resulting in a decline to $8,000 levels.
 

ETH/USD

We had forecast a rally to $1174.36, which is the 61.8 percent Fibonacci retracement level of the recent fall from $1424 to $770 and Ethereum topped out at $1,160 on Jan 20.

The price has returned to the trendline support, which has offered strong support since Dec. 10.

The bulls have been attempting to hold the trendline support for the past two days. We believe the support zone between $900 and $845 is likely to be defended strongly by the bulls. The ETH/USD pair will indicate a change in trend only after it breaks out of the down trendline.

If the above-mentioned support zone breaks, the decline can extend to $770 levels. We don’t find any buy setups; hence, we are not suggesting any trade on it.


BCH/USD

In our previous analysis, we had anticipated Bitcoin Cash to return from the $2,072 levels, and it topped out at $2,112.11 on Jan. 20.

The moving average has completed a bearish crossover, and the price is quoting below the 20-day EMA and the 50-day SMA; which is advantageous to bears. If the retest of the recent lows at $1364.96 fails, a fall to $1194 is likely.

If the bulls defend the $1364.96 levels, the BCH/USD pair is likely to become range-bound for a few days.

As the trend is still down, we are not suggesting any trade on it.
 

XRP/USD

Ripple returned from the 20-day EMA on Jan. 18. It currently has support at the $0.87 levels.

We believe that the XRP/USD pair will become range bound for the next few days between the support of $0.87 and the resistance of $1.74.

We shall wait for a breakout above the overhead resistance to initiate any long positions. On the downside, though we expect the $0.87 to hold, it might be reasonable to wait for a bounce before buying. As the trading inside the range is likely to be volatile, we shall only try to buy closer to the supports.

IOTA/USD

We had mentioned that $3.032 is the critical level for IOTA and a failure to break out above it will attract another bout of selling and that is what happened.

The cryptocurrency is currently attempting to hold the Jan. 16 low of $1.923. If the bears succeed in breaking down this support, a fall to the lows of Dec. 22 of $1.10 is likely.

If the bulls hold the $1.923 levels, the IOTA/USD pair is likely to remain range bound for the next few days. It will become positive only if the price breaks out of the down trendline of the descending triangle.
 

LTC/USD

Litecoin broke above $205, but could not reach $225, as we had expected. It turned down from $214.48 levels on Jan. 20.

The bears are trying to break down of the critical support level of $175.19. If successful, a fall to $140 is likely.

In the short-term, the first sign of bullishness will be when the LTC/USD pair breaks out of $215. Currently, we don’t find any trade set up on it.
 

XEM/USD

On Jan. 20 and Jan. 21, the bulls could not sustain above the downtrend line. As a result, NEM has resumed its decline.

Currently, the bulls are attempting to hold the $0.86 level. If this breaks, a fall to the Jan. 16 lows of $0.551 is likely.

On the upside, the down trendline is likely to offer strong resistance. The first signs of bullishness will be when price breaks out of the $1.21 levels.

We don’t find any trade setups on the XEM/USD pair.
 

ADA/BTC

Cardano could not break out of the 0.00006 levels. It is now likely to gradually fall to the support levels of 0.000047, and after that to 0.00004070.

For the next few days, we expect the ADA/BTC pair to remain range bound between 0.00004070 on the downside and 0.00006915 on the upside.

We shall wait for the pair to bounce from one of the support levels before initiating any trade. At the present levels, we don’t find any bullish setups on it.


Author: Rakesh Upadhyay


Posted By David Ogden Entrepreneur
David ogden Cryptocurrency Entrepreneur

Alan Zibluk – Markethive Founding Member

Price Analysis, Jan. 19 – Bitcoin, Ethereum, Bitcoin Cash, Ripple, IOTA, Litecoin, NEM, Cardano

Price Analysis, Jan. 19 - Bitcoin, Ethereum, Bitcoin Cash, Ripple, IOTA, Litecoin, NEM, Cardano

Price Analysis, Jan. 19 – Bitcoin, Ethereum, Bitcoin Cash, Ripple, IOTA, Litecoin, NEM, Cardano

After a sharp fall, the aggressive bulls jump in and buy at lower levels. This strategy has resulted in huge gains for the cryptocurrency traders in 2017. However, unlike previous occasions, we have not seen a sharp rise this time. This shows that the traders are not confident of a huge rally from the current prices.

In the next few days, we expect a range bound action in most of the top cryptocurrencies.

BTC/USD

We had expected a pullback from the $10,704.99 levels. But Bitcoin overshot on the downside and fell to $9,300 levels.

Currently, the bulls are attempting a reversal, which is likely to carry the cryptocurrency to the neckline of the head and shoulders pattern at $13,202 levels.

We expect another round of selling from those levels, which is likely to sink the BTC/USD pair back to the support zone of $10,704.99 to $9,300. If this support zone breaks, a fall below $8,000 is likely.

On the other hand, if the bulls succeed in holding the support zone, it will lead to a start of a new uptrend. Nimble-footed traders can play the rise, but others should wait for more clarity to develop.


ETH/USD

We expected the support zone between the trendline and $940 to hold. On Jan. 17, Ethereum broke below the trendline and fell to a low of $770.

The bulls bought the dip aggressively, which has resulted in a pullback that carried the cryptocurrency towards the 50 percent Fibonacci retracement levels of the recent fall from $1424 to $770.

For the past three days, the ETH/USD pair has been struggling to cross above $1097. If the price breaks out of the $1100 levels, we expect a move to $1174.36 and $1284.28 levels. As the stop loss is $930, which doesn’t offer a good risk to reward ratio, we are not suggesting any trade on it.


BCH/USD

We expected the $1733 levels to hold. Still, the bears easily broke through it and Bitcoin Cash fell to a low of $1364.96 on Jan. 18.

The current increase is likely to face resistance at the $2072 levels, which was the support of the range previously. We shall get a confirmation of a bottom during the next downturn. If $1364.96 breaks, a fall to $1194 is likely.

Our bearish view will be invalidated if the BCH/USD pair sustains above $2072 for a day.


XRP/USD

We had forecast a fall to 61.8 percent Fibonacci retracement levels of the latest rally, however, Ripple fell close to the 78.6 percent retracement levels, which coincided with the lower end of the descending channel.

The cryptocurrency has broken out of the descending channel, which suggests that the downtrend is over. However, the present increase is facing resistance at the 20-day EMA, above which a move to $2.20 is likely. At that price, the XRP/USD pair will face resistance from the trendline that had previously acted as a strong support.

However, if the cryptocurrency fails to break above the 20-day EMA, the bears will attempt to resume the downtrend. Support lies at $0.87.

We expect a few days of range bound trading.


IOTA/USD

IOTA broke down of the bearish descending triangle pattern on January 16, which gives it a pattern target of $1.10.

However, the cryptocurrency took support at $1.93 levels on Jan. 17.

Currently, the IOTA/USD pair is retesting the breakout levels of $3.032. If the bulls breakout of the overhead resistance and the downtrend line, our bearish view will be invalidated.

However, if the bears defend the $3.032 levels, we are likely to see another bout of selling, which will retest the lows.

We don’t find any clear pattern; hence, we are not recommending any trade.


LTC/USD

We had forecast a likely fall to $100 if Litecoin broke below $175.19. It rose from a low of $140.00 on Jan. 17.

For two days in a row, Jan. 16 and Jan. 17, the bears broke down below $175.19 but were unsuccessful in holding prices down.

If the bulls breakout of $205, a move to $225 is likely, where both the moving averages converge. This level is likely to act as a resistance.

We don’t find any reasonable trades on LTC/USD pair.


XEM/USD

NEM fell close to the 78.6 percent retracement levels on Jan. 16 and Jan. 17. Thereafter, the bulls have commenced a pullback, which is likely to face a strong resistance at the downward trendline.

If the price moves above the downtrend line, an increase to $1.45 can’t be ruled out.

The next fall towards the recent lows of $0.55134 will confirm whether the bottom is in place or is there further to go.

Until then, we shall remain on the sidelines on the XEM/USD pair.

ADA/BTC


Cardano broke below the trendline support on Jan. 16 and Jan. 17, however, the bulls defended the support and pushed prices higher quickly.

The ADA/BTC pair broke out of the downtrend line yesterday, Jan. 18, however, it could not pick up momentum. It is struggling to rally above 0.00006. Once bulls breakout of 0.00006, a move to 0.00007 and thereafter to the 0.00008 levels is likely.

The cryptocurrency pair will become negative below 0.00004730.


Author: Rakesh Upadhyay


Posted by David Ogden Entrepreneur


Alan Zibluk – Markethive Founding Member

Bitcoin, Ethereum, Bitcoin Cash, Ripple, IOTA, Litecoin, Dash, Monero: Price Analysis, Dec. 30

Bitcoin, Ethereum, Bitcoin Cash, Ripple, IOTA, Litecoin, Dash, Monero

Bitcoin, Ethereum, Bitcoin Cash, Ripple, IOTA, Litecoin, Dash, Monero: Price Analysis, Dec. 30

Cryptocurrencies have generated wealth for the traders like no other asset class. While Bitcoin has garnered most of the attention, it is not the only one to have risen in 2017. There have been scores of winners.

Ethereum was the second leading currencies aiming to overtake Bitcoin as the dominant leader of the year; it could never really achieve the feat.

However, within the past two weeks, Ripple has skyrocketed from a low of $0.22 on Dec. 10, to a high of $2.47 today. That’s a whopping rally of 1024 percent within a span of 20 days.

As a result, Ripple has now overtaken Ethereum as the second most valuable currency by market capitalization.

Bitcoin’s dominance, which had risen above 60 percent just a few weeks back has again cooled off to 38.3 percent.

As the market matures, we are likely to see a number of changes in the rankings of these currencies. Therefore, one has to keep an open mind towards all the cryptocurrencies because as traders; our main goal is to earn money.

So, do we have any good buy setups for the end of the year or is it best to remain on the sidelines and enjoy the holidays, returning to trade in the new year? Let’s find out.

BTC/USD

We expected a pullback from the trendline, however, due to lack of buyers, the recovery never gained strength. Today, the bears easily broke below the trendline support, which has escalated the selling.

Bitcoin has broken down of the neckline of the bearish head and shoulders pattern. If the cryptocurrency sustains below the neckline, it has a pattern target of $5,745.

However, we don’t expect to see such a plunge in the short-term.

We believe that the bulls will attempt to defend the recent lows of $10,704.99. But if they fail, the bears are likely to intensify their selling. A number of long positions will start to bleed, which is likely to lead to panic selling. We see another support at the $8,000 mark.

All these lower levels will come into play only if the BTC/USD pair breaks and sustains below the 50-day SMA.

Contrarily, if the bears are unable to breakdown of the 50-day SMA, we may see a recovery in the new year. Yet, we will prefer to wait until the digital currency breaks out of the downtrend line to initiate any position. We don’t find any trades at the current price.
 

ETH/USD

We mentioned that Ethereum will become positive in the short-term only on a breakout and close above the downtrend line. Yesterday, the bulls broke out of the trendline but could not manage a close above it.

On the downside, the 20-day EMA has been providing a strong support. If this support level breaks, we may see a slide towards $646.08 and thereafter to $600 levels. On the other hand, the ETH/USD pair will become positive above $770 because it has returned from the $760 levels on three occasions.

Between the 20-day EMA and $760, we are likely to witness a volatile range-bound trading action.

Therefore, we suggest waiting until we get a clear breakout and a confirmation of the resumption of the uptrend.
 

BCH/USD

For the past two days, the bulls had been defending the $2300 mark. But their attempt to resume the rally failed yesterday.

Today, the bears have broken down of the critical support level of $2300. The next downside target on the BCH/USD pair is a fall to the 50-day SMA.

We expect a strong buying around the $1,733 levels. Nonetheless, we recommend waiting until there is a clear bottom in sight.

Consider avoiding buying in a falling market.
 

XRP/USD

Ripple roared past our initial target objective of $1.5. Today, it reached an intraday high of $2.474.

Traders who had purchased on our bullish prediction should close their positions or at least trail with a close stop loss depending on their strategy.

After such a stellar rally, we expect the XRP/USD pair to enter into a correction or a consolidation. Therefore, we don’t have any fresh buy recommendations on it.


IOTA/USD

The bulls have successfully held on to the lower end of the range at $3.032 for the past few days. However, they have not been able to push the cryptocurrency higher.

Today, the IOTA/USD pair is again under a bear attack, which is threatening to break below the critical support. If the bears succeed, the cryptocurrency will fall to the 61.8 percent Fibonacci retracement level of $2.62196.

Yet, if the bulls manage to hold the supports once again today, IOTA will continue to trade inside the range. We shall initiate buy positions only on a breakout and close above the downtrend line. Until then, we shall remain on the sidelines.

LTC/USD

The bears have broken below the neckline of the head and shoulders pattern. Unless the bulls stage takes a sharp recovery today, chances are that Litecoin will continue lower in the next few days.

We anticipate a strong support at the recent lows of $175.199. The 50-day SMA is also just below this level, which should also provide some support.

However, if both these levels fail to hold, the LTC/USD pair will fall towards $110, which is the target objective of the breakdown of the head and shoulders pattern.

Our bearish view will be invalidated if the bulls manage to push the digital currency above the neckline at $240.
 

DASH/USD

For the past two days, the bulls managed to hold on to the 20-day EMA. But today, the bears have broken below the moving average support.

Dash has a strong support at the trendline. We expect the bulls to strongly defend this level.

Though we shall avoid buying until we get a confirmation of a bottom formation because if the trendline breaks, the DASH/USD pair can fall to $800 and thereafter to $650 levels.
 

XMR/USD

We were expecting a range-bound trading action in Monero. Despite that, the bears have taken control and have broken below the 20-day EMA today, which is a bearish development.

The immediate support on Monero is at $300. If this level breaks down, we are likely to see the decline extend to the recent lows of $245.1. The 50-day SMA is also at this level. Just below there is the 61.8 percent Fibonacci retracement level of $230.66.

We expect a strong support in this zone. At the same time, we don’t suggest buying until the fall is arrested.

When the markets are in a bear grip, it is a good strategy to wait until the decline ends, instead of being brave and attempting to catch a falling knife.


Author: Rakesh Upadhyay


Posted By David Ogden Entrepreneur
David Ogden Cryptocurrency Entrepreneur

Alan Zibluk – Markethive Founding Member

Bitcoin is passé: these are the cryptocurrencies to look at in 2018

Bitcoin is passé: these are the cryptocurrencies to look at in 2018

Bitcoin is passé: these are the cryptocurrencies to look at in 2018

Bitcoin had a monumental 2017, with its price rising by more than 1,400pc over the past year. However, it was far from the best-performing cryptocurrency.

Of the 10 most important digital currencies by total value at the time of writing, six have been around for more than a year. All six have experienced price rises that eclipse Bitcoin, ranging from 2,870pc for Monero to 31,560pc for NEM.

As the first blockchain-based cryptocurrency, Bitcoin contains many flaws that later rivals have aimed to iron out. Transaction numbers per second are severely limited, “mining” – producing – Bitcoin consumes huge amounts of energy, and the transaction fees required for a payment to be processed quickly have been spiraling out of control.

All of these problems place doubt on Bitcoin’s ability to become a widely adopted means of payment, and ultimately on its value.

Gary McFarlane, a cryptocurrency analyst at investment shop Interactive Investor, said: “Bitcoin is the benchmark for the cryptocurrency market – other coins are judged by what they do differently to it, and how they address its flaws.

“No cryptocurrency has achieved mass adoption as a means of payment yet, so later projects that can address earlier technological issues are in a better position.”

So, aside from Bitcoin, which cryptocurrencies do those who analyse the fledgling cryptocurrency “market” have their eye on in 2018? Before you part with any money, bear in mind that any cryptocurrency investment is highly speculative, so only risk cash that you could afford to lose in its entirety and will not need in the short term.
 

Iota

Total value: $9.5bn

Iota stands for Internet of Things Application, and differs significantly from Bitcoin.

Instead of transactions being bundled together into “blocks”, those blocks being verified by a “miner” and then added to a blockchain ledger, as happens with Bitcoin, Iota uses a different technology called the “Tangle”.

Each transaction remains separate, is not amalgamated into blocks, and there are no separate miners who compete to verify transactions.

Instead, for a transaction to go through, the computer, smartphone or other device the transaction originated from must complete a mathematical problem to confirm two other random transactions.

There are no transaction fees, as the only cost is the amount of electricity a device uses to verify those transactions, which is borne by the user. In theory, this system could attain huge scale, as the more transactions that are put through, the more capacity there is to verify new transactions.

Mr McFarlane said there was a “good team” behind Iota and there were major companies interested in the technology, including Microsoft.

It is intended to be used as part of the “internet of things” – where homes, appliances and other day-to-day items are connected and communicate via a network. Its creators envisage that Iota will be used to enable micro-transactions and to allow almost anything, from a bicycle to computer processing power, to be rented out in real time.


Cardano

Total value: $10.2bn

Mr McFarlane said Cardano was sometimes described as an “Ethereum killer”. Like Ethereum, it is a platform that digital applications can be run on, with its own digital currency. Cardano is the name of the platform, while Ada is the currency.

“The person who heads Cardano was part of the core Ethereum team and the Cardano team are trying to address some of the problems they see with Ethereum,” he added.

Instead of using a “proof-of-work” system to verify transactions, where “miners” dedicate computing power to solving complex mathematical problems, Cardano uses a “proof-of-stake” system.

The power to verify transactions is determined by the number of coins a user holds, which also determines whether they can vote on proposed upgrades to the system. Those who verify transactions are rewarded with transaction fees.

The idea is that this system negates the need for a power-hungry proof-of-work system like that used by Bitcoin, and that those with larger stakes are incentivised to maintain a functioning system.

Critics say that in theory proof-of-stake systems are more open to certain kinds of attack, although penalties can be applied to discourage such abuse. They also point out that the largest stakeholders receive the most in transaction fees, which could give them more and more control over time.
 

Other Bitcoin rivals

David Drake, a professional investor who serves ultra-high net worth families, said he had high hopes for Verge and EOS, in addition to Iota.

He said the focus over the next six to 12 months would be on transaction speeds and the technology that underlies cryptocurrencies – areas in which Verge and EOS perform well.

Verge is focused on privacy, intending to offer completely anonymous transactions. EOS is similar to Ethereum in that it is a platform on which developers can build digital applications. EOS coins are the currency of the platform.

They are the 11th and 21st largest cryptocurrencies respectively, at $5.4bn and $1.8bn in total value.
 

How to buy

None of the currencies mentioned above is currently offered by the most popular cryptocurrency exchanges, Blockchain.info and Coinbase. That may change in the future.

Buyers will therefore require more technical knowhow and will need to carry out more research. You will need to find a cryptocurrency exchange that offers the currency you wish to buy, and a wallet service that will let you store it.

Watch out for the large number of scam outfits that appear in search engine results in this area; they may be difficult to distinguish from legitimate businesses.

You can also choose to store cryptocurrencies offline in a "hardware wallet", essentially a hard drive.

Be sure to check the fees charged by any exchange or wallet provider and the difference between the actual price of a coin and the price being offered to you.

You may be able to purchase some coins only with larger cryptocurrencies such as Bitcoin, rather than with cash. In that case, you will need to buy some of the required currency first.


Author James Connington 29 DECEMBER 2017 • 12:09PM


Posted by David Ogden Entrepreneur
David Ogden Cryptocurrency Entrepreneur
 

Alan Zibluk – Markethive Founding Member

Ethereum, Bitcoin Prices Slide as Market Sheds $10 Billion

Ethereum, Bitcoin Prices Slide as Market Sheds $10 Billion

Ethereum, Bitcoin Prices Slide as Market Sheds $10 Billion

The crypto markets took a steep downward turn on Friday, with more than 90 of the top 100 cryptocurrencies posting single-day price declines. The bitcoin price dropped nearly $400 after challenging the $4,000 level earlier in the week, while the ethereum price slipped below $260.

Chart from CoinMarketCap

The total cryptocurrency market cap–the combined value of all cryptocurrencies–dropped more than $10 billion for the day. After beginning the day at about $133 billion, the crypto market cap quickly dropped below the $130 billion threshold, where it languished leading into Friday morning. At present, the total crypto market cap is about $122 billion.

Chart from CoinMarketCap

Bitcoin Price Dips Toward $3,500

Bitcoin was at the head of the retreat, dipping nearly $400 from its Thursday morning mark of $3,900. Market manipulation or not, the bitcoin price has tapered quite a bit since its early-week recovery. In the past day alone, it has dipped 6%, despite the fact that a prominent industry figure said a trusted source had told him that China will not extend its bitcoin crackdown to mining. At present, the bitcoin price is trading at a global average of $3,564, which translates into a $59.1 billion market cap.

Bitcoin Price Chart from CoinMarketCap

Meanwhile, JP Morgan CEO Jamie Dimon has taken another potshot at bitcoin, claiming that it’s “worth nothing” just a week after calling it a fraud.

Ethereum Price Dips Another 6%

The ethereum price mirrored bitcoin’s decline, dipping 6% for the day. After entering the day above $270, the ethereum price struggled to hold above that mark. Ultimately, it dove through the $260 level, too, bringing it to a current price of $257. Ethereum now has a market cap of $24.4 billion.

Ethereum Price Chart from CoinMarketCap

Bitcoin Cash Posts Double-Digit Decline

The bitcoin cash price careened downward on Friday, posting the worst single-day performance of any top 15 coin. Within the past 24 hours, the bitcoin cash price has fallen by more than $50–a 10% drop. At present, bitcoin cash is trading at $407 and has a market cap of just $6.8 billion.

Bitcoin Cash Price Chart from CoinMarketCap

Altcoins Trend Down

The altcoin markets joined in the retreat, with nearly every top 100 cryptocurrency declining for the day. Fourth-ranked Ripple saw its price fall 5% to $0.17, while Dash slid 3% to $337.

Altcoin Price Chart from CoinMarketCap

The litecoin price fell 8% to just under $46. The 6th-ranked coin now sits at just 50% of the $92 record it set on September 2.

Litecoin Price Chart from CoinMarketCap

NEM–whose single-day trading volume is just $3 million–declined 6% to $0.204, while IOTA dropped 5% to $0.484. Monero, whose price approached $150 less than a month ago, is now trading at just $85 following Friday’s 7% skid. Ethereum classic rounds out the top 10 with an 8% decline that forced its market cap below $1 billion.
 

Author: Josiah Wilmoth on 22/09/2017


Postedby David Ogden Entrepreneur

Alan Zibluk – Markethive Founding Member

Record $5,000 Bitcoin Price Triggers $13 Billion Market Sell-Off

Record $5,000 Bitcoin Price Triggers $13 Billion Market Sell-Off

Record $5,000 Bitcoin Price Triggers $13 Billion Market Sell-Off

The bitcoin price touched $5,000 this morning, ushering in a historic moment for the cryptocurrency ecosystem. Unfortunately, this achievement also triggered off a comprehensive market sell-off. Almost every major cryptocurrency–including ethereum, Ripple, and IOTA–experienced significant price decreases.

Record $5,000 Bitcoin Price Triggers $13 Billion Market Sell-Off

Chart from CoinMarketCap

The sell-off led to a significant crypto market cap pullback. At the height of the rally, the total value of all cryptocurrencies reached $179.7 billion–a new all-time high. However, nearly $13 billion of that has evaporated in the past 12 hours, bringing the current market cap to about $167 billion.

Chart from CoinMarketCap

Bitcoin Price Hits $5,000, then Dives

The bitcoin price crossed the $5,000 threshold on several exchanges during the early morning hours of September 2, raising the global average price to an all-time high of $4,975. Unfortunately, the bitcoin price did not sustain that level for long. By 3:30 UTC, the bitcoin price had fallen to $4,800. Within another three hours, it had plunged to $4,625. Bitcoin rallied back to $4,775, but the upward momentum did not continue. By the time of writing, the bitcoin price had dropped to $4,630, which translates to a $76.6 billion market cap.

Bitcoin Price Chart from CoinMarketCap

Ethereum Price Rally Stalls

The bitcoin sell-off led to a widespread market pullback, and the ethereum price was not immune. For most of September 1, the ethereum price hovered at about $390. But once bitcoin began to fall, ethereum followed. The ethereum price plunged as low as $352 at 6:00 UTC and currently sits at $357. This reduced ethereum’s market cap to $33.7 billion–a 24-hour decline of 8%.

Ethereum Price Chart from CoinMarketCap

Litecoin Price Reaches $92 for New ATH

The altcoin markets turned red following the bitcoin sell-off, and only three top 25 cryptocurrencies made positive movement for the day.

After inching back to $600 yesterday, the bitcoin cash price dropped to $591. The Ripple price mirrored ethereum’s plight, dropping 8% to $0.231.

Altcoin Price Chart from CoinMarketCap

Litecoin was one of the rare coins with a 24-hour price increase. The litecoin price increased 6% to $80. During the past day, only bitcoin boasted a trading volume greater than litecoin’s $1.7 billion.

However, what this statistic conceals is the fact that the litecoin price had actually risen to a new all-time high of $92 this morning, meaning that it has dropped $12 from its daily peak. Litecoin now has a market cap greater than $4.2 billion.

Litecoin Price Chart from CoinMarketCap

The NEM price fell 5% but maintained a slight market cap edge on Dash, which returned a 6% decline. The Monero price, meanwhile, fell 8%, forcing its market cap below $2 billion. Tenth-ranked IOTA had the worst performance of any top 10 coin, plunging 20% to $0.678.

IOTA Price Chart from CoinMarketCap

Aside from litecoin, only two top 25 cryptocurrencies increased in value over the past 24 hours. Ethereum classic, now ranked 9th, grew 3% to $20 as part of its latter-week rally. NEO, which recently dropped out of the top 10 following a steep decline, managed to defy the wider markets and rise 5% to $33.

Bitcoin Dominance Stable for Week

Bitcoin’s slice of the total crypto market cap ended the week at 45.8%, which is just slightly below where it began. Ethereum’s share had swelled during the middle of the week but had tapered to 20.1% by Saturday. Litecoin recorded the week’s most significant gains, rising from 1.7% on August 26 to 2.5% on September 2.

Market Cap Distribution Chart from CoinMarketCap

As the distribution currently stands, bitcoin cash and Ripple account for 5.9% and 5.3%, respectively. The remaining ~20% is divided between the other 1,000 or so coins and assets tracked by CoinMarketCap


Author: Josiah Wilmoth on 02/09/2017

Posted by David Ogden Entrepreneur

Alan Zibluk – Markethive Founding Member