Bitcoin Price Weekly Analysis – BTC Rebound Approaching Crucial Resistance

Bitcoin Price Weekly Analysis - BTC Rebound Approaching Crucial Resistance

Bitcoin Price Weekly Analysis – BTC Rebound Approaching Crucial Resistance

  • Bitcoin price formed a support base near $3,370 and recovered higher above $3,450 against the US Dollar.

  • There was a break above a major contracting triangle with resistance at $3,440 on the 4-hours chart of the BTC/USD pair (data feed from Kraken).

  • The pair seems to be approaching a couple of important resistances near $3,500 and $3,510.

Bitcoin price is slowly moving higher with positive signs against the US Dollar. However, BTC/USD is now approaching a significant hurdle near the $3,500 resistance zone.

Bitcoin Price Analysis

This past week, bitcoin price remained in a bearish zone below the $3,500 resistance against the US Dollar. The BTC/USD pair tested the $3,375 support area on the couple of occasions and later bounced back. The pair moved above the $3,400 and $3,420 resistance levels to start a decent recovery. The price also traded above the 23.6% Fib retracement level of the last decline from the $3,673 high to $3,346 low. There was a positive price action developed above the $3,440 resistance level.

Moreover, there was a break above a major contracting triangle with resistance at $3,440 on the 4-hours chart of the BTC/USD pair. The price spiked above the $3,475 resistance level, but it remained well below the 100 simple moving average (4-hours). Besides, there was no test of the 50% Fib retracement level of the last decline from the $3,673 high to $3,346 low. Buyers failed to clear the $3,500 resistance area, which ignited bearish moves. At the outset, the price is trading near the $3,440 level, with supports near $3,420 and $3,400. If there is a downside break below $3,400, the price is likely to test the $3,350 and $3,320 levels.

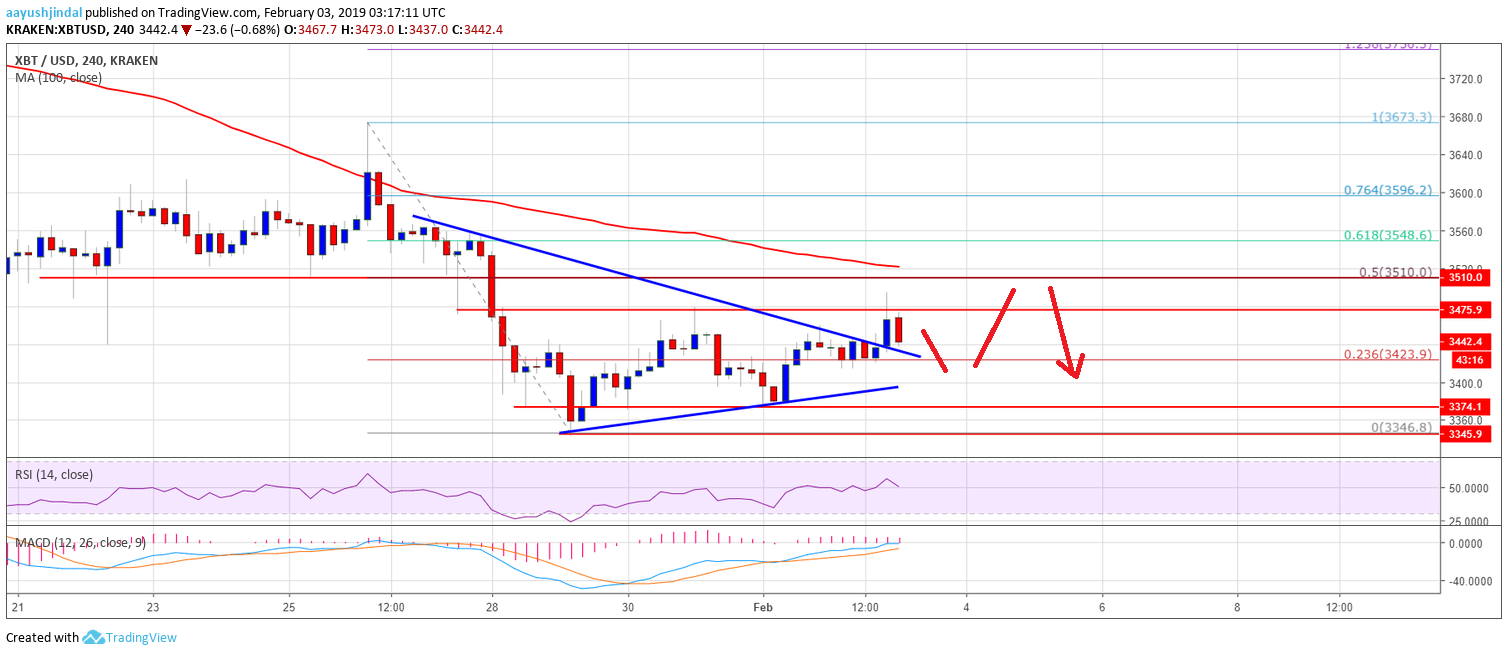
Looking at the chart, BTC price is clearly facing a solid resistance near the $3,500 level and the 100 SMA. As long as the price is trading below $3,500, there is a risk of a downside break in the near term.
 

Technical indicators

4-hours MACD – The MACD for BTC/USD is slightly placed in the bullish zone.

4-hours RSI (Relative Strength Index) – The RSI for BTC/USD is currently well above the 50 level.

Major Support Level – $3,400

Major Resistance Level – $3,500


AAYUSH JINDAL | FEBRUARY 3, 2019 | 5:00 AM

Alan Zibluk Markethive Founding Member

Bitcoin Is Now Officially In Its Longest Bear Market Ever


Bitcoin Is Now Officially In Its Longest Bear Market Ever

Bitcoin has officially entered the longest stretch of declining prices in its 10-year history.

The world’s oldest and most valuable cryptocurrency achieved an all-time high of $19,764 on Dec. 17, 2017 on the CoinDesk Bitcoin Price Index and has printed a series of lower price highs ever since, making February 2 (as per UTC time), the 411th consecutive day prices have been in decline.

As such, bitcoin’s latest stretch surpasses the duration of the infamous 2013-2015 bitcoin bear market, which spanned 410 days from its price high to low.

Bitcoin’s Historical Price Declines

Indeed, bitcoin’s most recent stretch of declining prices is the longest in duration ever witnessed by the cryptocurrency, but it has yet to become the worst in terms of total depreciation.

As can be seen in the chart above, bitcoin’s first significant bear market in 2011 spanned just 163 days but remains the worst performer to date.

From its price high of $31.50 to $2.01 low, bitcoin’s price fell slightly more than 93 percent, which is a steeper drop than the subsequent 2013-15 bear market when prices fell 86 percent from the previous high. The current bear market still has yet to exceed a depreciation of more than 84 percent from its all-time high, while its current prices near $3,400 register an 82 percent decline.

No one can be certain if or when bitcoin’s record decline will come to an end, but whether it be the market’s subdued response to the withdrawal of a highly anticipated bitcoin exchange-traded fund (ETF) proposal or bitcoin’s next deflationary halving event slowly approaching, it does seem evidence is beginning to mount for a bitcoin bottom occurring in the not too distant future.

Weekly chart and halving history

As part of bitcoin’s deflationary monetary policy, the rewards per mined block get cut in half every four years or 210,000 blocks, as a result slowing the creation of new bitcoins.

The event is now known as a “halving” and has long been considered a bullish catalyst for bitcoin’s price since the existing or growing demand for the cryptocurrency is likely to outweigh the slowing production of supply. Simply put, since demand is greater than supply, it creates a higher valuation for the underlying asset, regardless of the market.

As the tweet below from CoinDesk Markets shows, bitcoin’s price trend tends to bottom out and rise substantially several months in advance of the actual halving date.

While the sample size is small, bitcoin’s price finding a floor 378 days before the 2012 halving and 539 days before the 2016 halving creates an average “bottom” date of 458 days or one-and-a-quarter years before an actual halving event

With the next halving likely to occur in late May of 2020, bitcoin is now just under 500 days away, so a potential bear market ending bottom date may not be too far off if investors preemptively price in the deflation of supply like they have in the past.

Coin News Telegraph

02/02/2019

Alan Zibluk Markethive Founding Member

Bitcoin The Bears Fight back to Drag Bitcoin to sub-3500

Bitcoin – The Bears Fight back to Drag Bitcoin to sub-$3,500

Bitcoin – The Bears Fight back to Drag Bitcoin to sub-$3,500

It’s back in the red and after a 6th consecutively monthly loss, can Bitcoin avoid sub-$3,000 levels?

Bitcoin fell by 0.73% on Thursday, partially reversing a 1.48% rise from Wednesday, to end the day at $3,503.8.

For the month of January, Bitcoin fell by 8.58% and for the bears, the monthly loss was a 6th consecutive monthly in the red, with Bitcoin seeing monthly gains in just 3 of the last 13 months.

A bullish start to the day saw Bitcoin rally to an intraday high $3,574.8, breaking through the first major resistance level at $3,569.33 before hitting reverse.

Sliding through to the early evening, Bitcoin fell to an intraday low $3,482.1 before finding support to move back through to $3,500 levels by the day’s end. Bitcoin managed to steer clear of the first major support level at $3,470.53 in spite of the reversal, with sub-$3,500 support continuing to limit the damage.

Elsewhere amongst the top 10 cryptos, there were no buck-trending moves on the day, with Tron seeing the heaviest losses on Thursday, sliding by 7.44% to eat into January’s gains.

The negative sentiment even weighed on Ripple’s XRP that had bounced on Wednesday on news of SWIFT adopting R3’s platform for global payments on a trial basis.

For January, it wasn’t a great month for the majors. Stellar’s Lumen saw the heaviest losses, down by 26.64%. Bitcoin Cash SV and Bitcoin Cash ABC were close behind, the pair down by 25.21% and by 24.03% respectively.

Ethereum managed to hold onto $100 levels, but a 19% slide in the month will leave it on the defensive going into February.

Bucking the trend through the month were Litecoin, which gained 4.9% and Tron’s TRX, which trailblazed its way through January with a 33.3% rally. It could have been a lot more had it not been for Thursday’s sell-off.

On the news front, there was very little driving the cryptomarket through the day, with even the news of VanEck resubmitting its Bitcoin ETF application providing little support. The reason for withdrawing had been the U.S government shutdown, rather than any material issues with the application, so there was very little reason for the market to respond.

At the time of writing, Bitcoin was down by 0.73% to $3,478.2. A bearish start to the day saw Bitcoin slide from a morning high $3,513.4 to a low $3,462.2. The pullback saw Bitcoin call on support at the first major support level at $3,465.67 before steadying, the morning high having come up well short of the first major resistance level at $3,558.37.

For the day ahead, a move back through the morning high $3,513.4 to $3,520 levels would support a run at the first major resistance level at 3,558.37. We can expect Bitcoin to continue to face plenty of resistance at $3,500 to pin Bitcoin back from a breakout to $3,600 levels on the day. For the bulls, a move back through to $3,500 would be needed and sentiment across the broader market will also need to shift to support a recovery.

Failure to move back through the morning high could see Bitcoin fall deeper into the red. A fall through the first major support level at $3,465.67 could see Bitcoin call on support at the second major support level at $3,427.53 before any recovery. We would expect Bitcoin to steer clear of sub-$3,400 levels on the day, barring a crypto meltdown event.


Bob Mason

42 minutes ago (Feb 01, 2019 4:

Alan Zibluk Markethive Founding Member