Tag Archives: bitcoin bears

Will Bitcoin cost 28000 by 2020? Vinny Lingham bets 20000 that it won’t

Will Bitcoin cost $28,000 by 2020? Vinny Lingham bets $20,000 that it won't

Will Bitcoin cost $28,000 by 2020? Vinny Lingham bets $20,000 that it won't

  • Vinny Lingham and Ronnie Moas bet on Bitcoin price movement.

  • BTC/USD resumes the decline during Asian hours.

The co-founder & CEO of the US-based startup Civic Vinny Lingham accepted the call from Ronnie Moas, the founder of investment company Standpoint Research, and bet $20,000 that Bitcoin price won't exceed $28,000 before December 31, 2019.

Moas believes that the demand for Bitcoin will be growing amid limited supply, which will lead to a substantial price increase up to $28,000 in 2019 and potentially to $50,000 by the end of 2020. Meanwhile, Lingham says that companies will have to sell their coins to cover expenses as mining and other cryptocurrency related activities are not that profitable anymore.

Whoever wins the bet, $20,000 will go to Free Ross charity, a group that provides a legal assistance to Silk Road creator Ross Ulbricht.

Meanwhile, Bitcoin dropped to $6,440 in Asia after an initial attempt to recover above $6,500. The most popular coin is changing hands at $6,444 with the Relative Strength Index pointing to further declines. The initial support lies with $6,400 with SMA200, 1-hour located right under that level. If it is cleared, the downside may be extended towards $6,300 congestion zone.


Tanya Abrosimova Tanya Abrosimova

FXStreet | 04:07 GMT

Alan Zibluk Markethive Founding Member

Bitcoin weekly price analysis 6112018


Bitcoin weekly price analysis – 6.11.2018

After dropping down to a low of $6,242 last week, bitcoin price started rising regularly hitting a week high of $6,529. Even though technical analysis of last week’s charts denoted that we are likely to witness a bearish market during most of the week’s trading sessions, a new upwards wave began manifesting itself last Wednesday following a short bearish move. The BTCUSD pair seems to be moving within a new rising upwards channel, which will not face significant resistance except around the $6,606 price level.

Bitcoin price and the news:

Last week witnessed circulation of news around a letter reporting supposed solvency of Tether (USDT), as a result to Tether’s new bank headquartered in the Bahamas (Deltec). Tether’s problems and allegations concerning Bitfinex’s insolvency have been raising significant concerns among the crypto community during the past few weeks.

Bitcoin traders are still waiting for serious decisions to come out from the SEC during the next few weeks. The SEC is expected to soon decide whether or not to approve Bitcoin ETFs. Also, the SEC is on its way to regulate ICOs with emphasis on three key elements of this blockchain based crowd funding process – issuers of ICOs, investors of unregistered ICOs, and exchanges facilitating trading of unregistered ICOs.

The retail banking giant JP Morgan is about to release its very own blockchain, which is expected to offer its huge client base a myriad of trading opportunities.

HTC, the Taiwanese mobile phone manufacturer, is launching its first blockchain-friendly smartphone, which is expected to feature compartmentalized storage of various forms of blockchain based data. The highly anticipated mobile phone will be available for purchase via cryptocurrencies only.

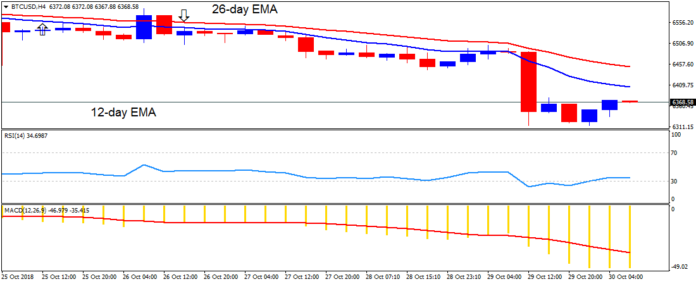
New rising upwards channel on the 4 hour BTCUSD chart:

Let’s examine the 4 hour BTCUSD chart from Bitfinex, while plotting the Williams Alligator’s SMAs, and the MACD indicator as shown on the below chart. We can note the following:

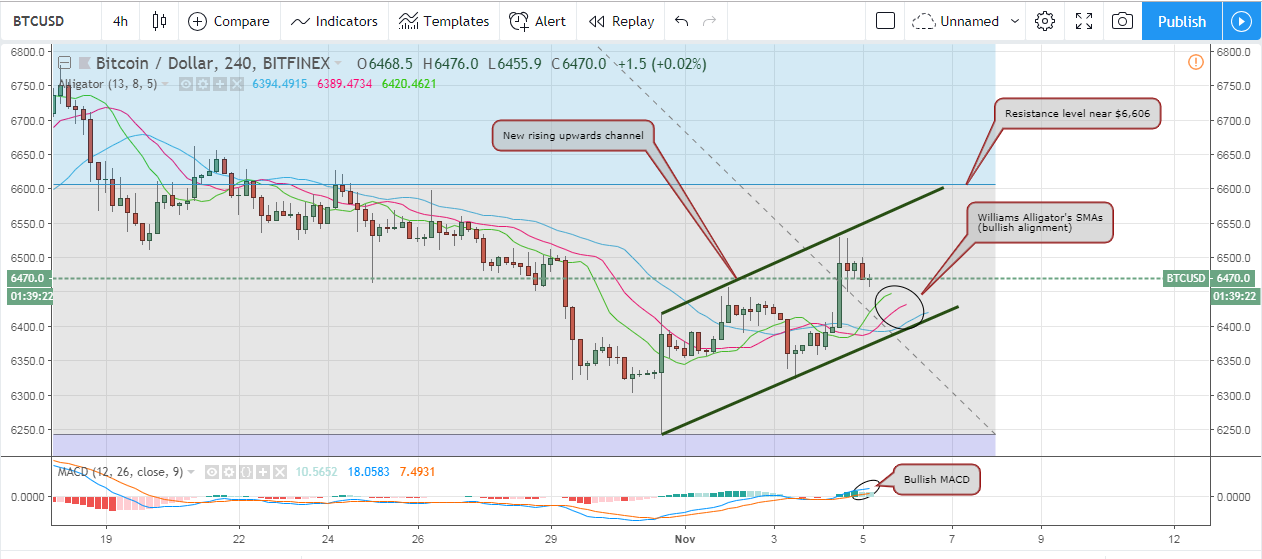
– Last week started with the market’s bears having the upper hand, managing to pull price downwards from around $6,512 all the way down to a week low of $6,242 on Wednesday. Thereafter, the market’s bulls gained control pushing the price steadily upwards to a week high of $6,529 on Sunday.

– Since last Wednesday, bitcoin price began recording higher lows during most of the trading sessions. Also, higher highs can be spotted on around 50% of the candlesticks on the 4 hour chart. The rising trend line formed by the highs, as well as the rising trend line formed by the lows formed a “rising upwards channel” (the two parallel green trend lines on the above chart). Bitcoin price has been moving throughout this new rising channel since last Wednesday, and is likely to continue rising throughout this channel until facing resistance around the $6,606 price level, which represents the 76.4% Fibonacci retracement between the high at $7,788 and the low at $6,242.

– The SMAs of the Williams Alligator have re-aligned themselves to exhibit a bullish alignment as bitcoin price began rising throughout the new rising channel. On Sunday, the green SMA (lips) moved on top of the red SMA (teeth), which rose above the blue SMA (jaw). As such, it is said that the alligator’s mouth has opened and will start eating, so we can expect to see a stronger bullish wave during the upcoming few days.

– The aforementioned bullish signals are confirmed by the MACD which is also exhibiting a bullish signal. The blue MACD line is on top of the red signal line and both are sloping in an upwards direction in the positive territory.

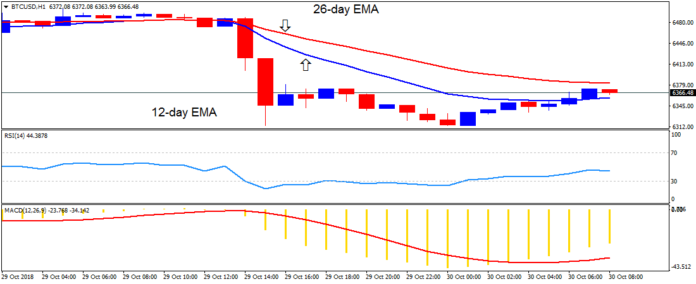
Ichimoku Cloud still red on the 1 day BTCUSD chart:

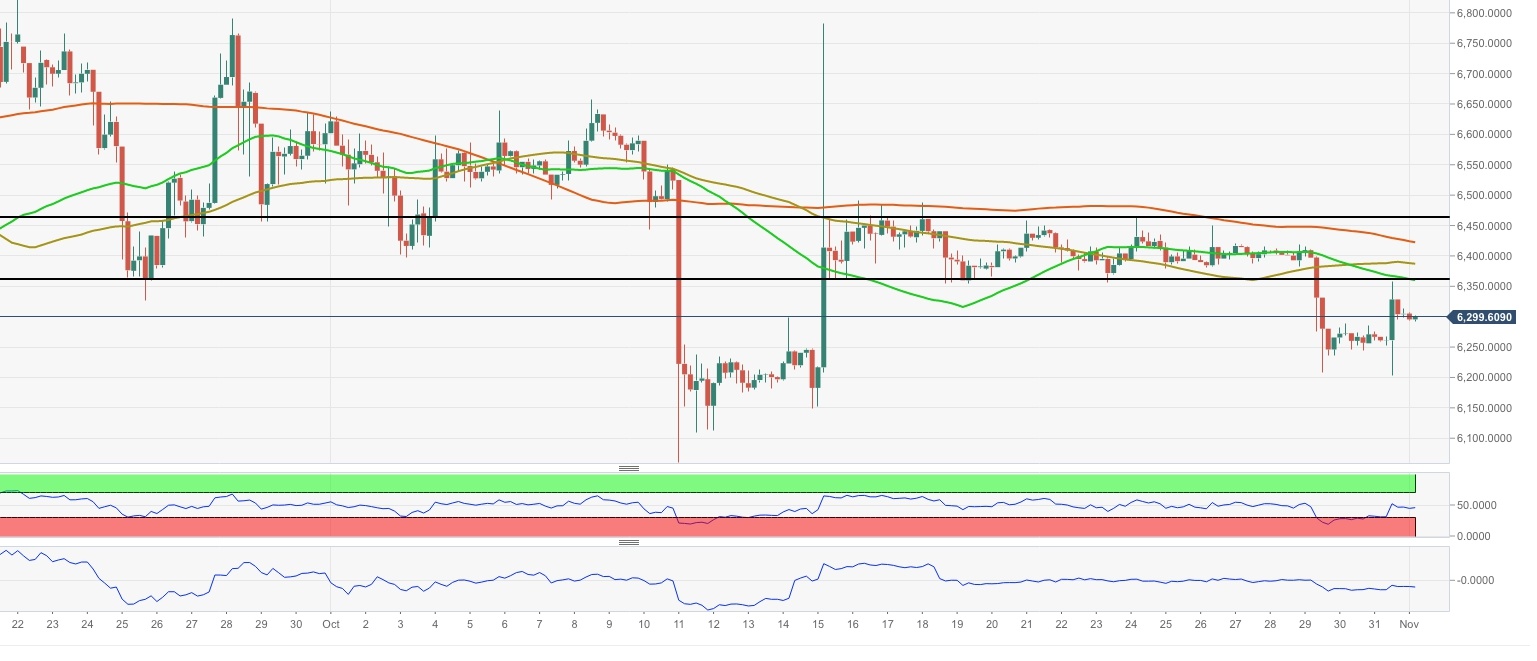
Now, let’s examine the 1 day BTCUSD chart from Bitfinex while plotting the Ichimoku Cloud, the RSI, and MACD indicator as shown on the below chart. We can note the following:

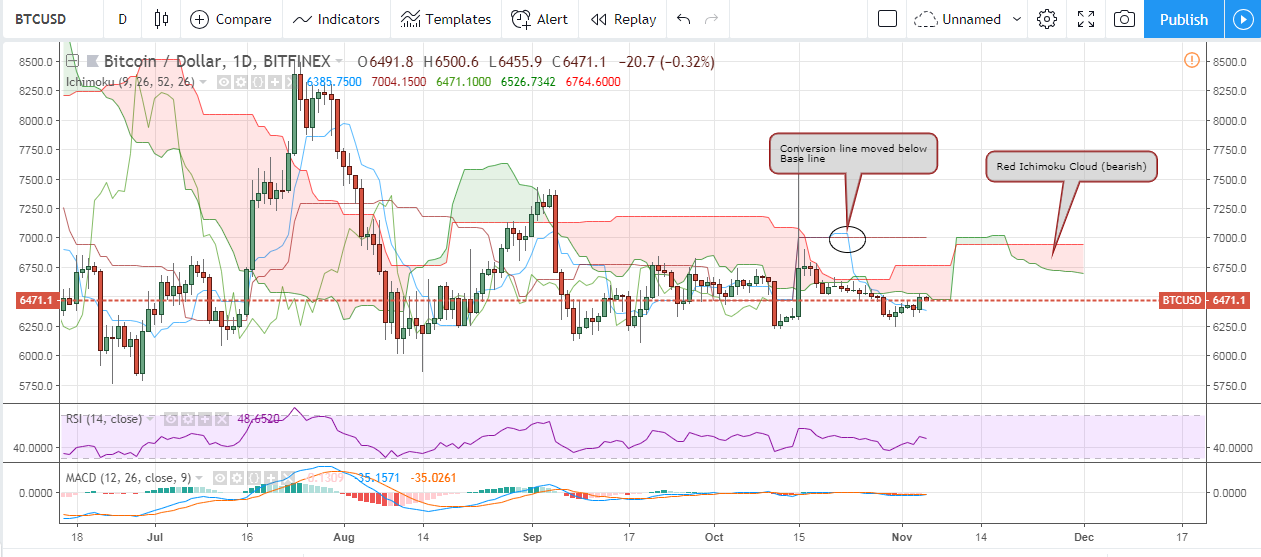
– The bullish signals we spotted on the 4 hour chart are not confirmed by analyzing the 1 day chart, as the Ichimoku Cloud is reddish (bearish), and its Conversion line (blue) has moved below the Base line (red). Also, candlesticks are below the cloud.

– The RSI level is near 50, which is more or less indecisive. The MACD indicator is in the negative territory and the MACD line is below the signal line.

Conclusion:

After recording a low of $6,242, a new bullish wave started building up last week pushing bitcoin price to a week high of $6,529. As bitcoin price is now moving throughout a new rising upwards channel, we can expect it to continue rising during the upcoming week towards the resistance around $6,606, even though we cannot confirm the bullish move by analyzing the 1 day BTCUSD chart.


POSTED BY: TAMER SAMEEH NOVEMBER 6, 2018

Bitcoin weekly price analysis – 6.11.2018

Alan Zibluk Markethive Founding Member

BTCUSD Price Analysis – Fate of Nine Bitcoin ETFs to Be Decided After Today

BTC/USD Price Analysis – Fate of Nine Bitcoin ETFs to Be Decided After Today

Encouragingly, the market is bullish and Bitcoin is up printing a three-bar reversal pattern as participants reject lower lows. We expect the recovery to continue this week as the SEC is set to announce the fate of nine Bitcoin ETF as the commenting period concludes today. Should these proposals be compliant with SEC stringent requirements then BTC/USD price could erupt above $7,200 closing the year on a high.

Latest Bitcoin News

Endorsement by the US SEC is always a boost for any crypto asset. Any unfavorable assessment or comment in a bad light can quickly mean the asset is a security. That’s undesirable and extra work for investors who must file tax returns whenever they make crypto transactions. That is extra work that prevent direct investment. The question in everybody’s mind right now is news about Bitcoin ETF whose comment date ends today.

Up until now the SEC has been adamant, denying the roll out of nine Bitcoin ETF from Direxion, Proshares and GraniteShares. Apparently, we have come to learn that the rejection was because of the SEC commissioners delegating these tasks to their staff. They did recall and ordered comments from interest parties to be made by Nov 5-which is today. From there on, we expect the SEC to make their decision but the exact time remain tentative.

Earlier, it was widely reported that the SEC would qualify VanEx SolidX Bitcoin ETF after a “successful” meeting between representatives of the VanEx, CBoE and some SEC commissioners. Hopefully, they make a favorable decision and allow firms that meet their stringent listing requirements a go-ahead injecting the market with the much-needed momentum.

BTC/USD Price Analysis

The recovery of the BTC/USD is an indication of a bottoming crypto market. Considering the +75 percent drop this year, odds are we may see a recovery this quarter. Aside from technical factors, the simmering trade war between the US and China could trigger capital flights from the stock market to Bitcoin which is borderless. As such, last week’s 0.2 percent gain could increase as prices bounce off from the $6,000 support line and building on the bull pin bar of last week. In line with our last BTC/USD price analysis, it would be ideal if prices thrust past the resistance trend line connecting the last nine months highs and print above $7,000–$7,200 buy trigger line. Thereafter, first targets would be $8,500 and later $10,000.

Technically, BTC/USD pair is trading within a bear break out pattern following Oct 29 price action. But, after yesterday’s rapid gains, we now have a three-bar, bull reversal pattern. Besides, our last BTC/USD plan will most likely be null after today. Regardless of the greens, we recommend patience until we see gains above $7,000 resistance level. Then, the trend would be clear and price action would be trading above a key resistance level at the back of high reversal volume.


DALMAS NGETICH | NOVEMBER 5, 2018 | 2:00 AM

Alan Zibluk Markethive Founding Member

Currently Bitcoin is gaining strength Report by OneAlpha says

“Currently, Bitcoin is gaining strength,” Report by OneAlpha says

“Currently, Bitcoin is gaining strength,” Report by OneAlpha says

"The December 2017 and January 2018 boom and bust had a cleansing effect on the ecosystem"

A report published in October by OneAlpha revealed that Bitcoin’s market was gaining strength after the 2018 correction. The stability of the last weeks is a sign of maturity of the markets that seem to have passed the hype stages -both bullish and bearish- of the previous months.

OneAlpha is an Israeli firm part of First Digital Assets Group; a fintech that defines itself as “the leading digital assets group in Europe.”

OneAlpha Report: Bearish Trend Is A Good Thing For The Market

According to the report, the current bearish trend was necessary. This decline in the markets served as a “relief” and generated a “cleansing effect” on the ecosystem.


The facts seem to prove the OneAlpha team right. After the abnormal bullish streak of 2017, many people entered the market in an abrupt and immature way. The 2018 correction seems to have given Bitcoin back the stability needed to gain more credibility as a “market” instead of its previous “bubble” image:

“From our perspective, the prolonged bear market provided the sector with a much-needed relief, lowering valuations to a more sensible level. Despite the considerable correction, a large portion of the value represents the future potential of the network rather than its current one. The December 2017 and January 2018 boom and bust had a cleansing effect on the ecosystem, removing many of the speculators and leaving mainly real investors, operators, and builders in the market. This is what was necessary to move forward and build a successful ecosystem.”

Bitcoin: Best Currency / Ethereum: Best Platform

The report is clear in dividing the cryptocurrency market into different branches. The first one is composed of well-known cryptocurrencies. For OneAlpha, 2018 has been a year during which Bitcoin has strengthened, recovering part of the influence taken away by other altcoins:

“Currently, Bitcoin is gaining strength and captures more than half of the total crypto market cap. Ethereum captures 10% of the total market cap. There are currently more than 2,000 traded crypto assets and more than 1,000 unique tokens worth around $14 billion. 87% of the tokens are Ethereum based, with NEO and Waves capturing around 2.4% each …

Of this valuation, it is noticeable that Bitcoin captures about 71% of all currencies and Ether 54% of all platforms.”

An Optimistic View Of The Future

The Report also highlights the importance that ICOs have had in increasing interaction with the public (despite cases of fraud and constant failures). It also points out the increase in institutional investments and blockchain technology patents registered in China and the United States.

The report gives a fairly positive view of the situation considering the facts from a broad perspective. Market behavior in 2018 is, according to analysts, a natural and necessary reaction to the craziness of 2017:

“We are experiencing a phase of sobriety and maturation – a decline in retail investment and a more careful, responsible approach from institutional investors on one hand and regulators around the world on the other. A long bear market might be the ideal climate to let the dust settle and examine, both internally and externally, the true possibilities that lay within the cryptocurrency and blockchain ecosystem. Ultimately, the goal is to take a step further and bridge the gap between consumers, traditional investors, and blockchain technology.”


Jose Antonio Lanz by Jose Antonio Lanz November 4, 2018 in Bitcoin News 0

Alan Zibluk Markethive Founding Member

Blockchain revolution is on the way as Bitcoin slips back under 6300

Blockchain revolution is on the way as Bitcoin slips back under $6,300

Blockchain revolution is on the way as Bitcoin slips back under $6,300

  • Bitcoin dips under $6,300 after a short recovery.

  • Adam Jiwan from Spring Labs touts blockchain technology.

Bitcoin is changing hands at $6,299, marginally higher since this time on Wednesday. However, the shrinking volatility and low trading activity make further upside unlikely.

On the intraday chart, BTC/USD returned to the area under $6,300 after Wednesday's recovery attempt. The stopped short of the lower line of the previous consolidation channel and SMA50 (4-hour). The support lies with $6,200. Once it is broken, the sell-off may gain traction with the next bullish aim at $6,100 and the recent low of $6,060.

The Relative Strength Index (RSI) recovered from oversold territory and settled at a neutral level, which means that more consolidation might be in store for us in the short-term.

Meanwhile, experts believe that the technology behind the cryptocurrency is likely to attract financial and intellectual capital, creating a technological revolution.“Regpic

ardless of how one feels about cryptocurrencies, bitcoin has ushered in a technological revolution that will have profound implications for how information is shared, consumed, and protected,” Adam Jiwan, CEO and co-founder of Spring Labs, explains.

Spring Labs is creating a blockchain-based ecosystem that will allow exchanging credit and identity information in a secure way

“I’m a big believer in the unstoppable nature of technological revolutions, and we’re only ten years into the development of distributed ledger technology. Blockchain will be ubiquitous, and the world will have to adjust. The only question is, “How soon?”


Tanya Abrosimova Tanya Abrosimova

FXStreet 23 minutes ago

Alan Zibluk Markethive Founding Member

Bitcoin BTC Daily Price Forecast October 30

Bitcoin (BTC) Daily Price Forecast – October 30

Bitcoin (BTC) Daily Price Forecast – October 30

BTC/USD Medium-term Trend: Bearish

Resistance Levels: $6,800, $7,000, $7,200

Support levels: $6,200, $6,000, $5,900

Yesterday, October 29, the price of Bitcoin was in a bearish trend. The digital currency had been range bound above the $6,500 price level in the last three weeks. The cryptocurrency fell to the low of $6,300 and commenced a range bound movement. Previously, the BTC price was range bound between the levels of $6,200 and $6,600.

The crypto's price is likely to revisit the previous low of $ 6,200. This was the lower price range which is likely to be tested. If the price falls again and holds at the $6,200 price level traders should initiate long trades. Then stop-loss orders should be placed below the $6,200 price level. Meanwhile, the MACD line and the signal line are below the zero line which indicates a sell signal. The price of Bitcoin is below the 12-day EMA and the 26-day EMA which indicates that price is in a bearish trend zone.

BTC/USD Short-term Trend: Bearish

On the 1-hour chart, the BTC price is in a bearish trend. The digital currency is below the 12-day EMA and the 26-day EMA which indicates that price is falling. Meanwhile, the MACD line and the signal line are below the zero line which indicates a sell signal.
 

The views and opinions expressed here do not reflect that of BitcoinExchangeGuide.com and do not constitute financial advice. Always do your own research.


By Azeez M – October 30, 2018

Alan Zibluk Markethive Founding Member

Bitcoin BTC Price Watch – Bears Refusing to Let Up

Bitcoin (BTC) Price Watch - Bears Refusing to Let Up

Bitcoin (BTC) Price Watch – Bears Refusing to Let Up

Bitcoin Price Key Highlights
 

  • Bitcoin price recently tumbled below a short-term rising trend line but might be due for a pullback.

  • Applying the Fib retracement tool on the latest swing high and low shows the levels where more sellers might be waiting.

  • However, technical indicators are giving mixed signals on whether the slide could resume or not.

Bitcoin price fell through a short-term support zone and might be due for a pullback before heading further south.


Technical Indicators Signals
 

The 100 SMA is below the longer-term 200 SMA to indicate that the path of least resistance is to the downside. In other words, the selloff is more likely to resume than to reverse from here.

Sellers might be waiting around the 61.8% Fib or $6,564 level which lines up with the broken rising trend line support. This is also close to the 100 SMA dynamic inflection point, which might add another layer of resistance.

Stochastic is pulling up without even hitting oversold territory, which suggests that buyers are eager to return. Sustained buying pressure could even take bitcoin price back up above the trend line to continue its climb. RSI is also pointing up to suggest that buyers might be ready to return. Reaching overbought levels and turning back down could still allow the Fibs to hold, pushing bitcoin price back to the swing low or lower.

Bitcoin was unable to sustain its earlier pop higher as profit-taking was quick. Traders must be feeling anxious on account of risk-off flows in general financial markets and while waiting for the SEC decision on bitcoin ETF applications.

Still, there’s a lot to look forward to, particularly the launch of ICE Bakkt bitcoin futures later this year. However, there might also be some unease as traders recall that last year’s CME bitcoin futures were blamed for the sharp drop that followed then.


SARAH JENN | OCTOBER 25, 2018 | 4:24 AM

Alan Zibluk Markethive Founding Member

Bitcoin BTC – Are Bears Back in the Game?


Bitcoin (BTC) - Are Bears Back in the Game?

Bitcoin (BTC) – Are Bears Back in the Game?


Bitcoin Price Key Highlights

  • Bitcoin price appears to be turning from the resistance at the top of its descending triangle on the 4-hour chart.

  • Price could be making its way back to the bottom of the triangle again from here.

  • Technical indicators are also reflecting the presence of selling pressure that could keep gains in check.

Bitcoin price seems to be having trouble sustaining its earlier climb as the top of the descending triangle is holding as resistance.

Technical Indicators Signals


The 100 SMA is below the longer-term 200 SMA on this time frame, confirming that the path of least resistance is to the downside. In other words, resistance is more likely to hold than to break. These moving averages also coincide with the triangle top to add to its strength as a ceiling.

Stochastic is on the move down so bitcoin price could follow suit while selling pressure is present. This oscillator has some room to go before reaching oversold levels, which means that sellers could stay in control for a bit longer. RSI is also heading south and has plenty of room to cover before reaching oversold territory as well.

The spike higher in bitcoin is seen to be a result of the selloff in Tether as doubts are emerging on its stability and the financial health of Bitfinex. However, traders quickly booked profits as most of the move was also spurred by FOMO or fear of missing out.

Still, there’s enough reason to expect a longer-term rally to materialize as institutional funds could flow in by early next year. Fidelity Investments has unveiled its institutional platform for bitcoin and ethereum, making it available to more hedge funds and financial institutions. Goldman Sachs has also reportedly invested in BitGo in order to make cryptocurrencies more accessible to its clients.

SARAH JENN | OCTOBER 19, 2018 | 4:35 AM

Alan Zibluk Markethive Founding Member

Bitcoin BTC Price Analysis – Tossing And Turning At Wedge Support


Bitcoin (BTC) Price Analysis – Tossing And Turning At Wedge Support

Bitcoin has spiked around current support levels as bulls and bears battle it out.


Bitcoin underwent a pickup in volatility, leading to spikes in both directions, but ultimately holding its head above the falling wedge support. Technical indicators are giving mixed signals, so it’s still tough to tell which direction the next move might go.


The 100 SMA just recently crossed below the longer-term 200 SMA to signal that the path of least resistance is to the downside. In other words, support is more likely to break than to hold. In that case, bitcoin could fall by the same height as the chart pattern. Price is also below the moving averages dynamic inflection points, which could keep holding as resistance.


RSI is on the move up, though, so there may be some buying pressure left in play. Heading further up until it reaches overbought levels could take bitcoin price along with it. Similarly stochastic has room to head higher before hitting overbought territory, so buyers could have some energy to push for more gains.


Price also looks ready to complete a double bottom formation on the latest bounce, with the neckline located around $6,600. A break past this resistance could spur a rally that’s the same height as the chart formation. Stronger bullish pressure could even lead to a test of the wedge resistance at $7,000 or a break higher, which might then be followed by a rally that’s the same height as the chart pattern.


Analysts point to the buildup of sell orders leading up to the SEC decision on bitcoin ETF applications. Recall that the regulator already rejected a handful then announced a decision to review those proposals. Soon after, the SEC decided to temporarily suspend a couple of crypto-based instruments, citing “confusion” on the nature of underlying markets and reiterating their mandate to protect consumers.


Still, bulls strongly defended support yet again as many have been waiting to buy on dips.

By Rachel Lee On Sep 20, 2018

Bitcoin (BTC) Price Analysis -  Tossing And Turning At Wedge Support

Alan Zibluk Markethive Founding Member

Bitcoin BTC Price Watch – Bearish Wedge Breakout

Bitcoin (BTC) Price Watch - Bearish Wedge Breakout

Bitcoin (BTC) Price Watch – Bearish Wedge Breakout

Bitcoin Price Key Highlights
 

  • Bitcoin price recently broke below a rising wedge pattern to signal that further losses are in the cards.

  • Price might still pull back to the broken support area, which lines up with Fib levels, to gather more selling pressure.

  • Technical indicators are showing that there is still some bullish momentum left.

Bitcoin price made a downside break from its rising wedge pattern but might be due for a pullback before heading further down.
 

Technical Indicators Signals


The 100 SMA is above the longer-term 200 SMA to indicate that the path of least resistance is still to the upside. In other words, there still might be a chance for the uptrend to resume.
 

However, the gap between the two is narrowing to reflect weaker bullish momentum and a possible downward crossover. Bitcoin price has also tumbled below both moving averages, so these might hold as dynamic resistance moving forward.
 

RSI is turning higher after recently dipping into oversold territory, suggesting a possible return in bullish pressure. Stochastic also looks ready to climb out of the oversold region and bitcoin price could follow suit once it heads north.
 

However, price could hit roadblocks at the Fib levels marked on the breakdown. The 61.8% Fib lines up with the broken wedge support around $6,430 and the 50% Fib lines up with the 200 SMA dynamic inflection point. If any of these levels keep gains in check, bitcoin price could resume the slide to the swing low or lower.

Risk aversion has returned to broader financial markets on account of the fresh set of tariffs imposed by the US on China. These tariffs, which are due to take effect on September 24, levy 10% of duties on $200 billion worth of Chinese goods and the rate would increase to 25% by the end of the year.


With that, it’s understandable that traders are dumping their riskier holdings and flocking back to the safe-havens. Cryptocurrencies have been deep in the red once more, with declines led by ethereum.

SARAH JENN | SEPTEMBER 18, 2018 | 3:52 AM

Alan Zibluk Markethive Founding Member