Bitcoin – Base formation or rising wedge?
-
BTC bears unable to break on the downside.
-
Bulls unable to cross past range $4,100-$4,400.
Bitcoin, the largest cryptocurrency by market capitalisation has been forming a technical pattern that's making it difficult for the bulls as well as bears to break past easily. However, as soon as it breaks on either side, the moves would be large enough
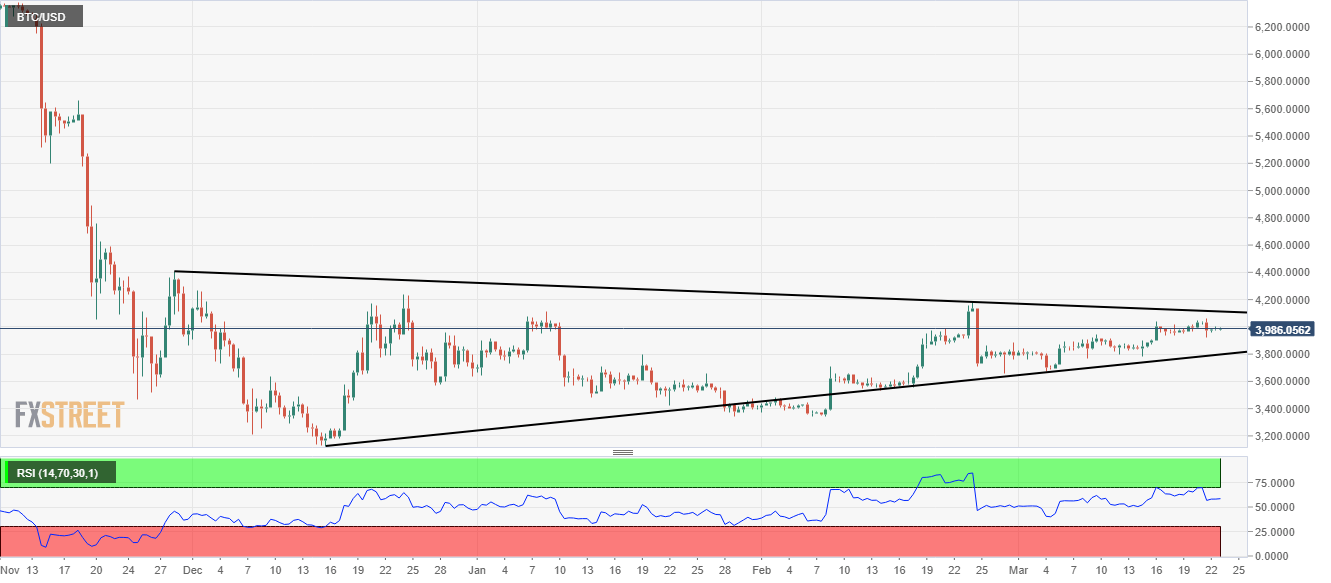
BTC/USD is trading flat on day at $3,986 and in less than one percent range for the day – proof of consolidation days of the poster boy of cryptos. On the 720-minute chart, after forming bottom of $3,126 in the month of December last year, the king of cryptos has been slowly and gradually moving up.
Inspite that, the bulls have not been able to cross past the range of $4,100-$4,400. Resulting in a base formation on the downside and a rising wedge like formation. If rising wedge holds true (which it may not, given past failures of falling wedges) then the next downside on BTC would be chaotic as the fall would then bring about sub-$2k levels.
BTC/USD 720-minute chart:


Alan Zibluk Markethive Founding Member
