Bitcoin Price Analysis – BTC Rebounds at Crucial Support – Can We Break $8K?
-
Bitcoin price $7,970
-
Key BTC resistance levels $8,000, $8,150, $8,265, $8,490, $8,600
-
Key BTC support levels $7,419, $7,200, $7,000, $6,954, $6,790
*Price at the time of publication
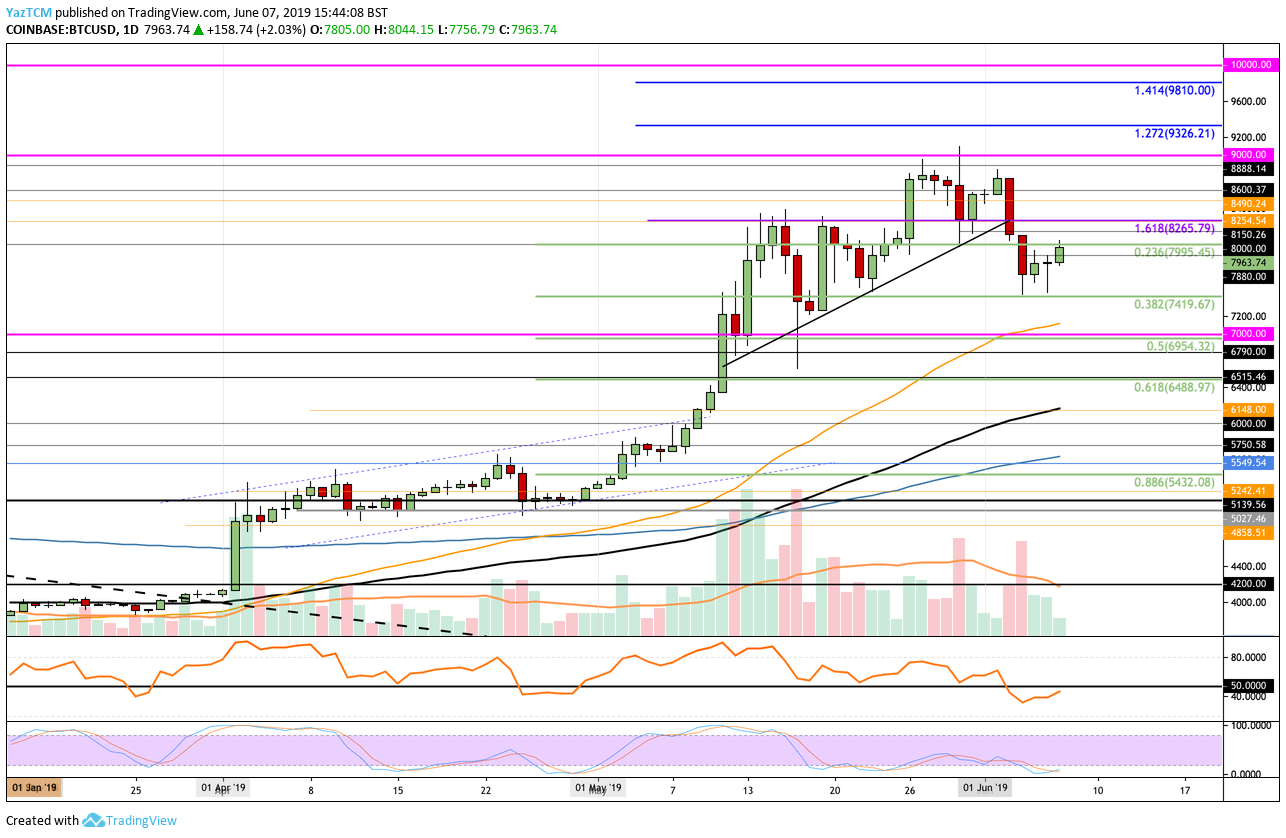
Bitcoin has seen a nice rebound totaling around 3% over the past 24 hours of trading and bringing the current price for the coin up to around $7,970 at the time of writing. The cryptocurrency had fallen from a peak above $9,000 to beneath the $8,000 level during the first few days of June 2019. However, BTC had managed to find support at the crucial .382 Fibonacci Retracement level and has rebounded from this area.
Bitcoin currently holds a $141 billion market cap valuation after seeing a 36% price surge over the past 30 days. Furthermore, the Bitcoin market has been on a tear over the past 3 months, as the price has exploded by a total of 101%.
Bitcoin price analysis

What has been going on?
Analysing the BTCUSD daily chart above, we can see that Bitcoin has recently found support at the short term .382 Fibonacci Retracement level (drawn in green) priced at $7,419. This Fibonacci Retracement is measuring the swing leg higher that had started to develop during May 2019.
Bitcoin has now rebounded from this level of strong support and is now attempting to break above resistance at the $8,000 level.
Bitcoin price short term prediction: Neutral
In the short term – Bitcoin remains neutral until it can break above the $8,000 level.
If the sellers do step in and begin to push the Bitcoin price lower, we can expect immediate support toward the downside to be located at the .382 Fibonacci Retracement support level at $7,419. Beneath this, further support can then be located at the $7,000 level. The support at $7,000 is further bolstered by the short term .5 Fibonacci Retracement level (drawn in green) priced at $6,954.
Bitcoin price medium term prediction: Bullish
Over a longer time period, Bitcoin remains bullish. After seeing a price surge of more than 100% over the past 3 months, it is hard to think that it is not bullish.
If the buyers are successful in breaking above the resistance at the $8,000 level, we can expect further resistance above to then be located at the $8,265 level. This level of resistance had caused trouble for the bulls during May 2019 and is expected to provide more trouble moving forward.
Above $8,265, more resistance is located at $8,490, $8,600, $8,888 and $9,000. Above $9,000 – further higher resistance is located at the short term 1.272 and 1.414 Fibonacci Extension levels (drawn in blue) priced at $9,326 and $9,810, respectively.
What are the technical indicators reading?
Currently, the Stochastic RSI is trading in extreme overbought conditions, which suggests that the selling is finally finished. If the Stochastic RSI can start to rise higher, we can expect the RSI to break back above the 50 level and allow the bulls to push the price further above $8,000.
13 hours ago | Yaz Sheikh
Alan Zibluk Markethive Founding Member
