Bitcoin (BTC) Price Weekly Analysis – Trend Overwhelmingly Bullish To $4,200
-
Bitcoin price slowly moved higher and dips remained supported above $3,800 against the US Dollar.
-
The price fell significantly recently, but buyers protected the $3,800 support area.
-
There is a crucial ascending channel is in place with support at $3,830 on the 4-hours chart of the BTC/USD pair (data feed from Kraken).
The pair remains in an uptrend and it is likely to accelerate above $4,000 and $4,100 in the near term.
Bitcoin price is grinding higher with a positive bias above $3,800 against the US Dollar. BTC/USD buyers are in control and they seem to eye a test of the $4,200 resistance level.
Bitcoin Price Analysis
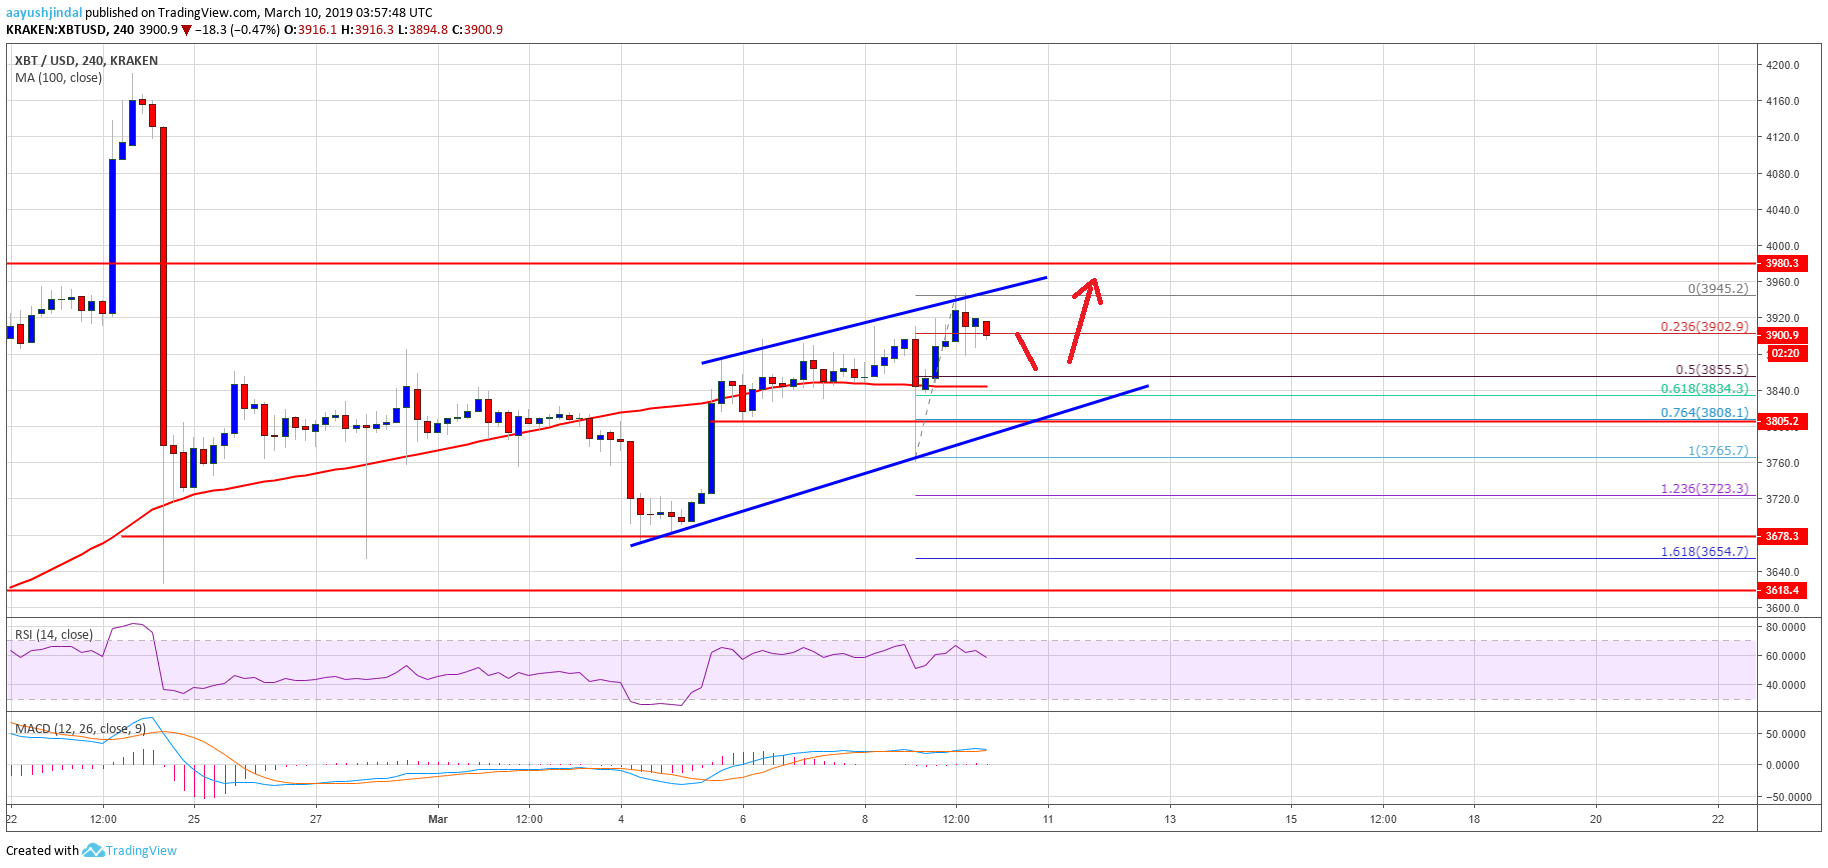
This past week, there was a steady rise from the $3,700 support area in bitcoin price against the US Dollar. The BTC/USD pair climbed higher and settled above the $3,800 resistance level and the 100 simple moving average (4-hours). However, the price faced a strong resistance near the $3,900 level. There were many attempts to clear the $3,900 barrier, but buyers failed to gain momentum. As a result, there was a sharp decline recently below the $3,850 level. The price even spiked below the $3,800 support and the 100 simple moving average (4-hours).
Buyers took a stand near the $3,760 level and later the price bounced back sharply. It broke the $3,900 resistance and settled well above the 100 simple moving average (4-hours). A new high was formed near the $3,945 level and the price is currently consolidating gains. It is testing the 23.6% Fib retracement level of the recent wave from the $3,765 low to $3,945 high. On the downside, there is a strong support formed near the $3,850 level. The 50% Fib retracement level of the recent wave from the $3,765 low to $3,945 high is also near $3,855.
More importantly, there is a crucial ascending channel is in place with support at $3,830 on the 4-hours chart of the BTC/USD pair. Therefore, the pair remains well supported on the downside near the $3,850 and $3,830 levels. On the upside, the price must break the $4,000 barrier for more gains in the near term.
Bitcoin Price Analysis BTC Chart

Looking at the chart, BTC price is clearly trading in an uptrend above the $3,850 and $3,830 supports. The main support is at $3,800, below which there is a risk of more losses. To the upside, a break above the $4,000 resistance may clear the path for a test of the $4,100 and $4,200 levels.
Technical indicators
4 hours MACD – The MACD for BTC/USD is slowly moving in the bullish zone.
4 hours RSI (Relative Strength Index) – The RSI for BTC/USD is correcting towards the 55 level.
Major Support Level – $3,830ser
Major Resistance Level – $4,000
AAYUSH JINDAL | MARCH 10, 2019 | 5:00 AM
Alan Zibluk Markethive Founding Member
