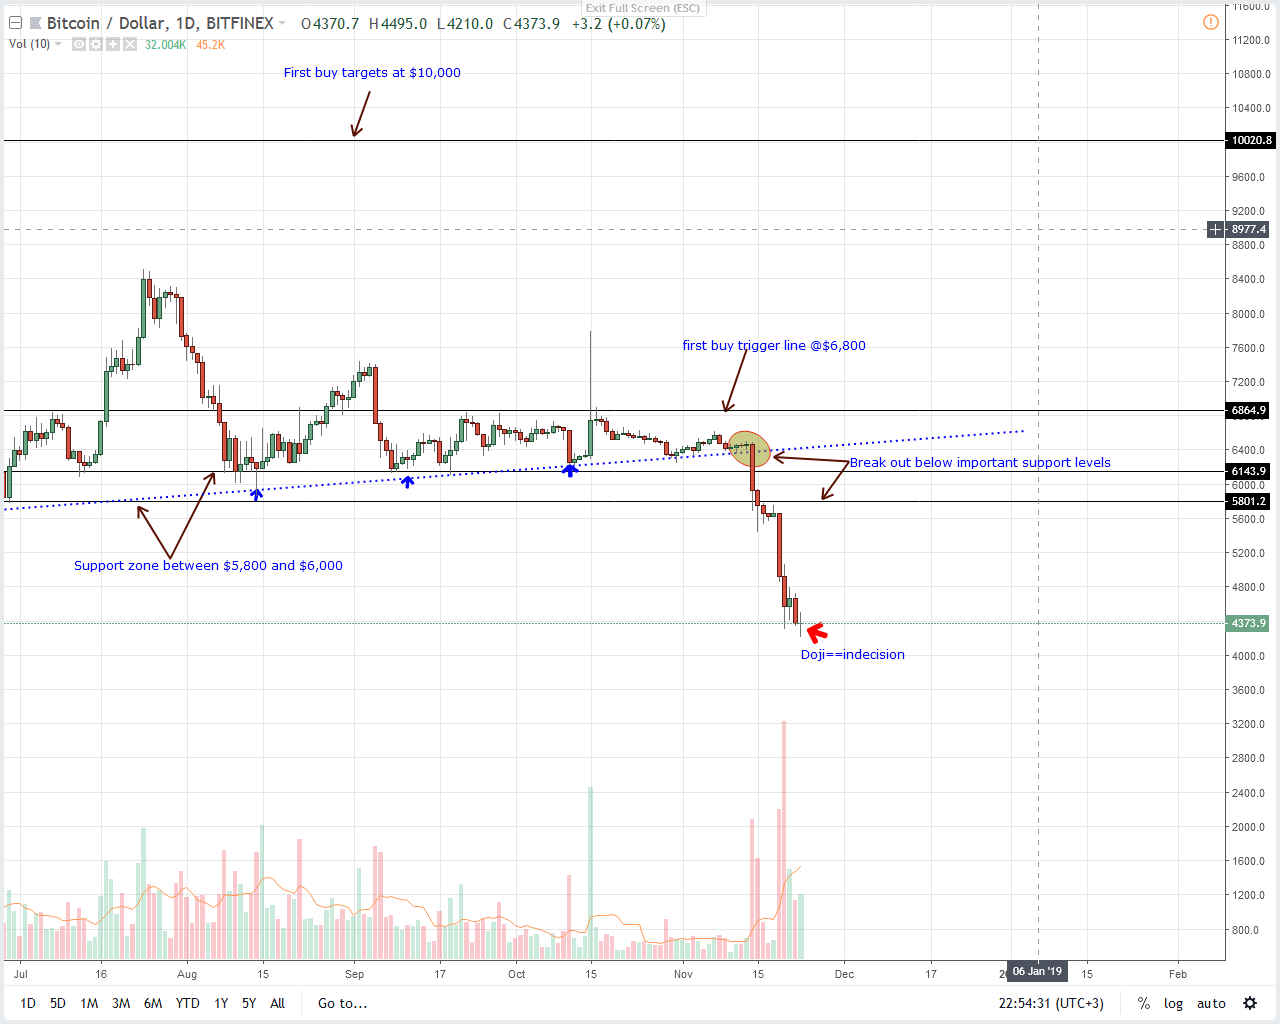
Bitcoin Moving in a $400 Range with Resistance at $4,700
The path of least resistance is clear and as long as prices are trading below $4,700 then we could see further declines towards $3,000 or lower. But even as analysts and investors track price, the survival of Bitcoin conjures memories of the dot com bubble. It did burst; birthing Amazon and Google, companies that wield so much control with individual market caps more than triple that of cryptos.
Latest Bitcoin News
Much has been talked about price, the collapse and the effect of low trading volumes. In fact there has been some comparison about the current bear market and the dot com bubble. Well, this isn’t the deepest correction Bitcoin traders have had to contend. Back in 2013-14, losses were deeper and prices more volatile mostly because of thin trading volumes as investment channels were few and Bitcoin not as common as it is now.
Regardless, blockchain and Bitcoin is a solution that is here to stay. Just like Paul Krugman, a non technical financial guru of yester years said the internet was a fad and famously suggested it would be no more transformational than the fax machine, current nay sayers as Jamie Dimon and Roubini or Dr Doom will surely watch as the technology shape and disrupt current systems.
While the contention is different there is strong correlation between events around the dot com bubble and recent discussions around DLTs, public blockchains and even competing protocols as IOTA. The mass is split and some are betting on IBM’s HyperLedger–interoperability, others on Bitcoin—security and community and more on the IOTA and the internet of things.
However, many are backing open source solutions to prevail over permissioned systems just like TCP/IP did nurturing current mega-corporations as Google and Amazon. If that is the case then the stars are sparkling for Bitcoin investors.
BTC/USD Price Analysis
Weekly Chart
Like before, the top down overview is pretty clear—BTC/USD is in a meltdown and poised to lose more as trading volumes dry up and the so called whales cover their positions to stay profitable. But, thing is even as bear pressure rage and threaten to wipe out 2017 super gains, prices have been stable in the last few days.
Moving within a tight $4,300-$4,700 range, there is obvious support. If prices close above $4,500 then odds are we might see prices recover above $5,000 and towards $5,500 as laid out before. Conversely, strong losses below $4,000 could open a flurry of sell orders pushing BTC towards $3,000–$3,500 from where analysts expect prices to find strong support.

The significance of $4,300–$4,500 support is beginning to show in the daily chart. Here, we have a doji bar, a mark of overall market indecision but still trading volumes are light.
Nonetheless, this did shore prices confining movements within a $200 range of which we expect buyers to build their momentum on.
Now, if today ends up as a bull, closing above immediate resistance of $4,700 then our previous upbeat BTC/USD price forecast would most likely go live as buyers thrust prices above $5,000 towards $5,500. If not and BTC capitulate below $4,000 then we shall trade as above.
All Charts Courtesy of Trading View
by DLT Guru November 24, 2018
Alan Zibluk Markethive Founding Member
