
Bitcoin price analysis – Break of $6,000 or breakout to $12,000?
-
BTC nearing a point of breaking out on the long term.
-
Falling wedge suggests, it should be upside breakout.
Bitcoin, the largest cryptocurrency by market capitalisation and defacto King of the crypto world, has been trading in a broad range of $6,000-$7,000 for past many weeks and is now reaching a point where it is potentially make or break for the bulls.
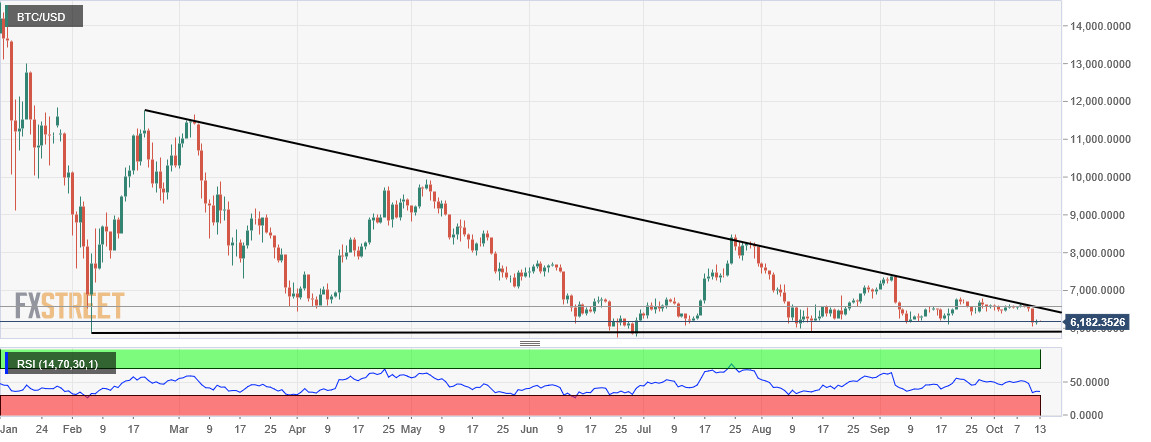
BTC/USD is down one cent of a percent at $6,185 in less than one percent range for the day, in a sign of lower weekend volatility. After falling from the upper end of the range, which is also a descending trendline resistance, BTC is now heading towards lower end of it – around $5,900.
This wedge formation, although has failed many times in the past, could be one positive trigger that the bulls were searching for. If bulls manage to bounce from the lower end of this range, then the next move on the upside should result into a breakout with potential targets of beyond $12,000 in the next few months.
BTC/USD daily chart:
Manoj B Rawal
FXStreet
Alan Zibluk Markethive Founding Member