
Bitcoin Price Analysis – Consolidation continues
Bitcoin (BTC) has continued to seesaw, sliding 20% since May 6th and then recovering slightly over the past few days. The market cap now stands at US$144.86 billion, with US$1.64 billion traded in the past 24 hours.
On the network side, hash rate and difficulty continue to push record highs, with ongoing shipments of ASICs from multiple mining companies, including Bitmain and Halong. Although the original Bitcoin Whitepaperdescribed Proof of Work (PoW) as “one-CPU-one-vote,” the lead SIA coin developer David Vorick argues that “for any algorithm, there will always be a path that custom hardware engineers can take to beat out general purpose hardware.”

Furthermore, ASIC chips are typically manufactured by a small number of technology companies, meaning the bulk of the network is running on the same hardware. If that hardware is found to be faulty or exploitable, the entire network is at risk.
Concerns over PoW have not been limited to ASIC proliferation. A recent presentation by Alex de Vries of Price Waterhouse Cooper in the Netherlands, “Bitcoin's Growing Energy Problem,” concludes that Bitcoin currently consumes at least 2.55 GW of electricity, and is on pace to consume 7.67 GW in the near future. This leaves the networks energy consumption comparable to countries such as Ireland now (3.1 GW) and Austria in the future (8.2 GW).
Others see this as an energy revolution opportunity. Peter Van Valkenburg of CoinCenter, a non-profit research and advocacy center focused on the public policy issues facing cryptocurrency in Washington D.C., has argued that instead of destroying the planet, Bitcoin will push the energy market towards more sustainable alternatives, driving an energy revolution. Mining in Canada and Iceland uses hydro and geothermal power, while wind and solar are among the cheapest energy sources available. Bitcoin advocate Andreas Antonopoulos shares this view and has questioned the hidden resource needs required by other payment platforms.
However, the number of network nodes has fallen slightly over the past few months after reaching more than 12,500 in November. These statistics include mining and non-mining nodes. Although archival nodes are not incentivized directly with a block reward, they ensure network consensus. Based on global distribution, the United States and Germany have the highest percentage of nodes.

Transactions per day remain down sharply from the record high in December, above 400k, and are currently below 200k per day. Transactions have not only declined due to a lack of usage but also transaction batching, where one transaction is sent to many addresses at once instead of each transaction being sent individually.

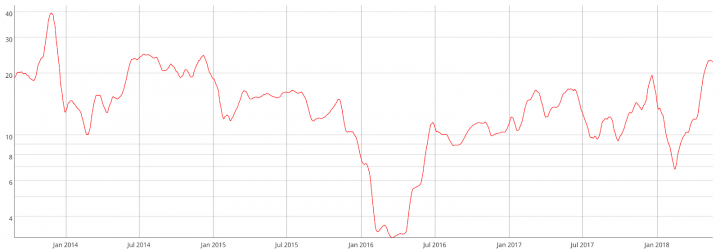
Using an adjusted network value to transactions (NVT) ratio, BTC remains in the upper-third of historical NVT value. While NVT has not been this high since January 2015 it has begun to turn downward recently, which suggests increasing on-chain network utility based on the dollar amount being transacted.
Although NVT is difficult to compare between coins, which use different transactions types, the ratio can be used to assess the network’s relative utility over time. DOGE is the only coin that has had an NVT consistently lower than BTC (not shown). Additionally, inflexion points in NVT ratio can be correlated to extreme highs or lows in price.
Transaction fees, which increased dramatically throughout 2017, have also declined significantly. This fee reduction is also multifactorial. Although a decrease in transactions per day means fewer transactions needing to be cleared, SegWit, which currently accounts for 39% of transactions, has also been a significant contributing factor to the average fee decline.

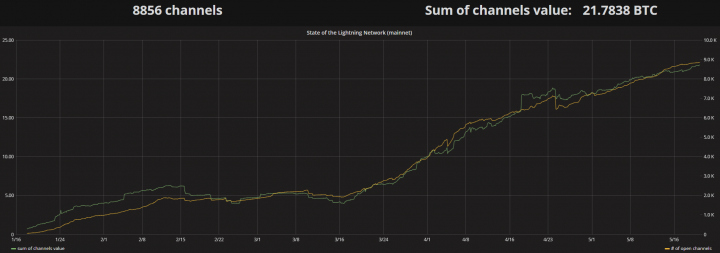
The SegWit soft fork also enabled second layer network upgrades like the Lightning Network. Since going live on March 15, the Lightning Network (LN) has continued to gain traction as new channels come online and apps are created.
The software solution enables trusted, bidirectional, off-chain, hub and spoke payment channels and also promises the possibility of instant payments, microtransactions, and increased scalability. The channels work much like a tab at a restaurant, which remains open until the client settles the bill. This format allows for numerous transactions to occur without a network fee until the channel is closed.
At Consensus NYC, Square co-founder and CEO Jack Dorsey and Lightning Labs co-founder and CEO Elizabeth Stark discussed their vision for the future of payments. Dorsey, who had an early interest in hacker and cypherpunk movements, was also an investor in a Lightning Labs seed round.
Dorsey focused on the need to keep Bitcoin an open source project and the need for a native currency of the internet. He also hinted at a Square and Lightning partnership down the road saying, "We want to go back to that original idea of being able to purchase a coffee with it. And that's why we're working with Lightning Labs. Whatever it takes to get there, we're going to make sure it happens."
During his keynote speech at Consensus, eToro CEO Yoni Assia announced a new American crypto platform which will be trading Bitcoin, Ethereum, Litecoin, XRP, Dash, Bitcoin Cash, Stellar, Ethereum Classic, NEO, and EOS. Cryptocurrency trading on eToro increased by 4,500% in 2017, according to MarketWatch.
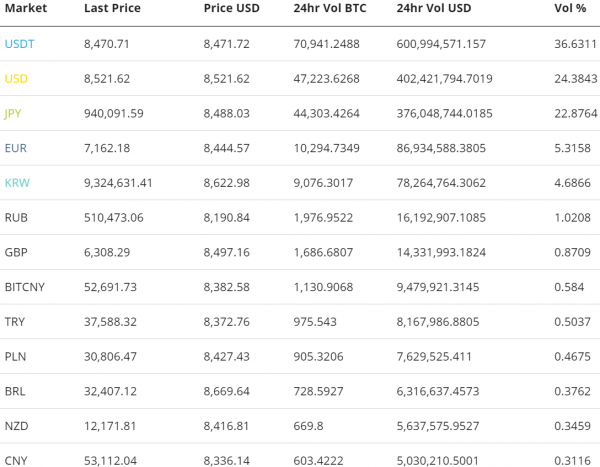
Bitcoin exchange traded volume this week has been led by the Tether (USDT) and USD markets for the fourth consecutive week, mostly on Binance, OKEX, and Bitfinex. In Asia, the JPY volume strongly leads the pack, thanks to friendly regulations and oversight, including declaring Bitcoin legal tender. The KRW premium is currently at 1.78%. CNY volume continues to fade.
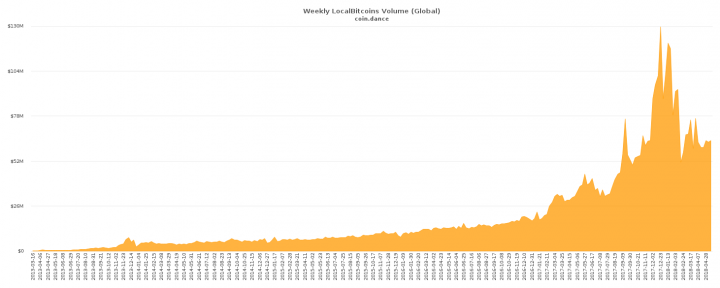
Globally reported over the counter (OTC) volume from LocalBitcoins.com remains sharply down from December and January but has begun to increase again. Venezuela continues to post record highs in Bolivar volume, fueled by hyperinflation. Thus far, the hyperinflation rate has followed an almost identical trajectory as the Weimar Republic. The Venezuelan president, Nicolás Maduro Moros, won the national election earlier today.
Technical Analysis
Bitcoin continues to drift sideways on low volume, with an inability to establish a clean trend on high timeframes. The status of any emerging or nascent trend can be determined using Moving Averages, Chart Patterns, Ichimoku Cloud, and Pitchforks. Further background information on the technical analysis discussed below can be found here.
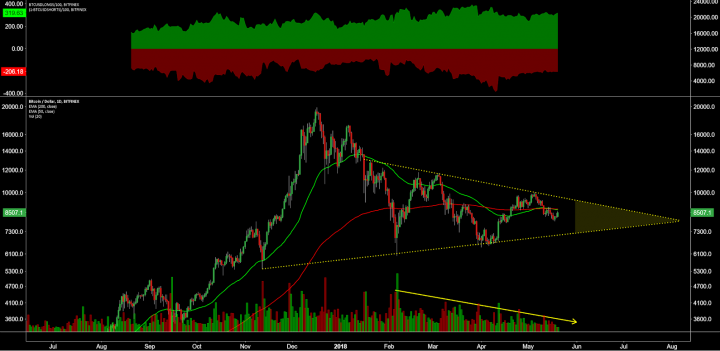
On the daily chart, open long/short interest on Bitfinex leans long, with shorts flat and longs rising (top panel, chart below). Exponential Moving Averages (EMAs) have gone flat, suggesting price consolidation. Price has fallen below the 200EMA with a bearish 50/200EMA cross.
Price structure shows a multi-month symmetrical triangle, or coil. In Technical Analysis of Stock Trends (1948), Edwards and Magee suggest that roughly 75% of these triangles lead to a continuation of the trend, while the rest mark reversals. In any case, this pattern will be a ‘trade the breakout’ situation because it will likely lead to weeks of trend follow through. Breakouts post consolidation typically occur after at least 66% of the triangle has completed (yellow highlight).
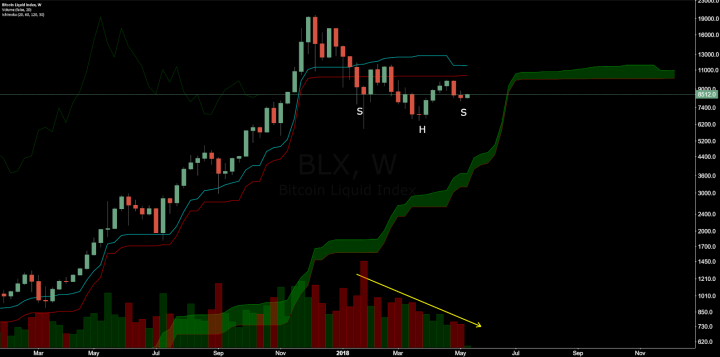
Turning to the Ichimoku Cloud on the weekly chart, there are four metrics; the current price in relation to the Cloud, the color of the Cloud (red for bearish, green for bullish), the Tenkan (T) and Kijun (K) cross, and the Lagging Span. The best entry always occurs when most of the signals flip from bearish to bullish, or vice versa.
The Cloud metrics on the weekly time frame are; price above Cloud, bullish Cloud, bullish TK cross, and Lagging Span above price and Cloud. Together, these signals suggest the trend is bullish, and will remain bullish until a bearish TK cross or price dips below the Cloud.
Price itself is below the Kijun and, seemingly, in no-man’s land. Price and volume structures suggest the possibility of an unconventional inverted head and shoulders, a bullish reversal pattern. A long entry would not be warranted until price is above the Kijun, essentially also above the neckline of the head and shoulders chart pattern.
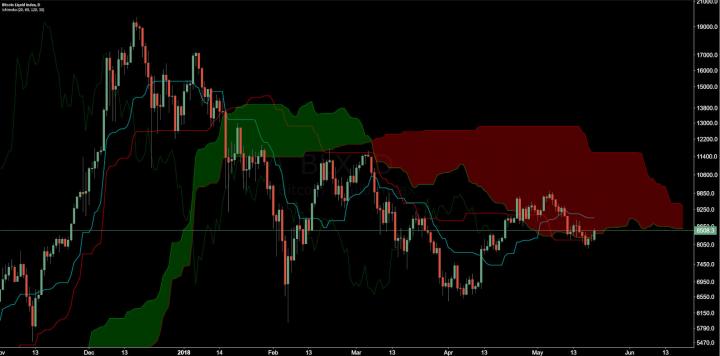
The Cloud metrics on the daily time frame are; price inside Cloud, bearish Cloud, bullish TK cross, and Lagging Span above price but below Cloud. A long entry based on traditional Cloud rules does not occur until the Cloud is breached by price, currently at ~US$11,586. However, a long reversal trade opportunity known as the Edge to Edge (E2E) trade can be taken advantage of with the current Cloud structure.
A long entry based on the E2E trade occurred several days ago, with a stop loss below the Kijun. Price dropped out of Cloud and below the Kijun, suggesting any active longs should be closed at that time. Although price has breached Cloud resistance for the second time, traders may avoid entering a second E2E trade this quickly as the previous E2E trade failed.
An E2E failing to reach its target is often an indication of additional consolidation being needed before price momentum returns. Price typically follows through with the direction of the E2E trade, but not until the Kumo twist, which in this case will occur after June 19th.
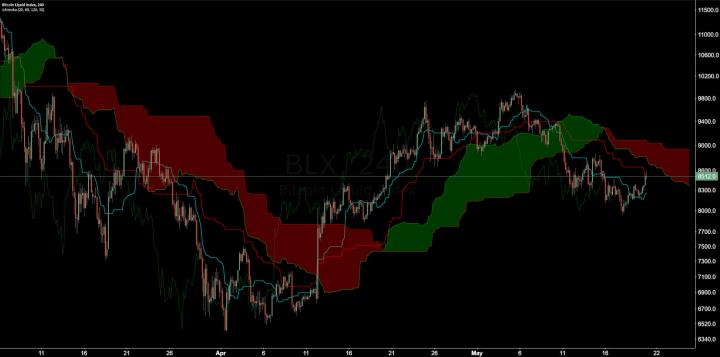
The Cloud metrics on the four hour time frame are; price below Cloud, bearish Cloud, bearish TK cross, and Lagging Span above price and below Cloud. A traditional long entry will not occur until price is above Cloud at ~US$8,942. An E2E long entry would trigger after a breach of Cloud at US$8,300. The previous four hour Kumo breakout led to a 27% price increase and both of the previous four hour E2E moves occurred in very few candles.
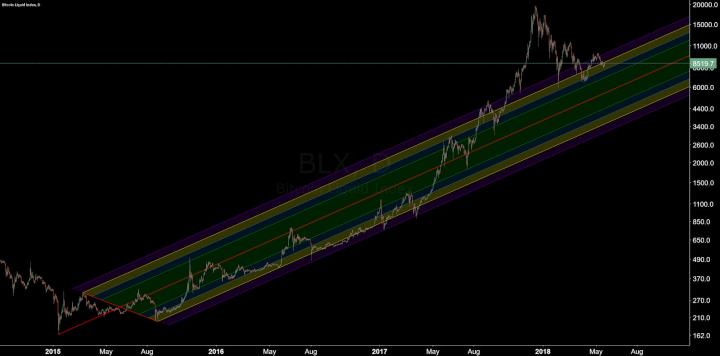
Penultimately, price has returned to the original upward trending Pitchfork beginning in 2015, with anchor points in January, May, and August of that year. Price broke North of this trend in October 2017 and again currently sits in the upper limits. A downside target of US~$5,700 is possible should price return to the mean (red line) of the prior trend.
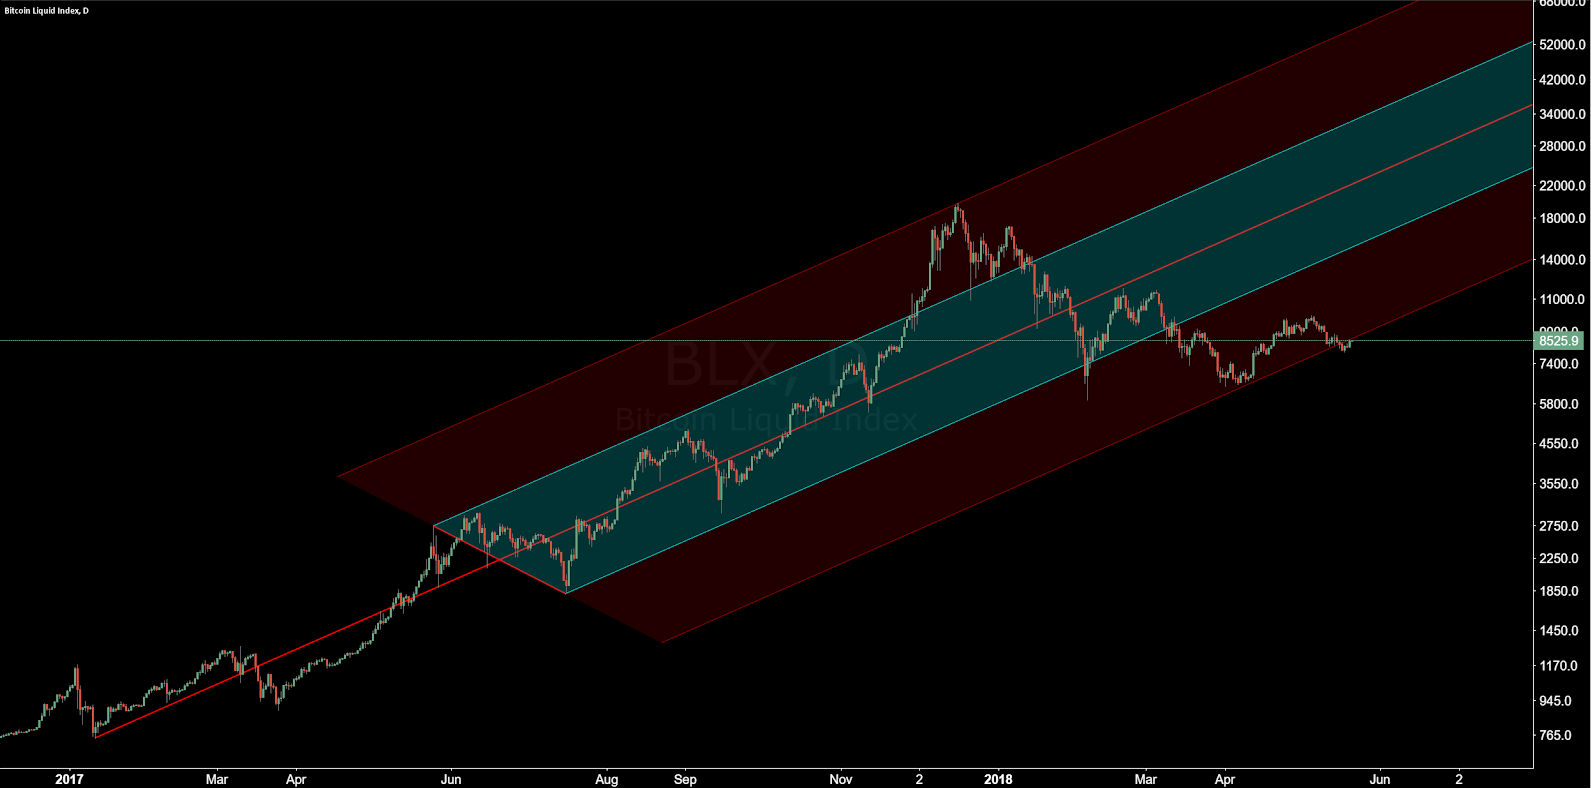
astly, another Pitchfork on the daily chart starting in 2017, with anchor points in January, May, and July, shows price reaching a similar distance below the mean (red line) as was reached above the mean in December. Price has closed this pitchfork for several days suggesting bearish invalidation. If price returns to inside the Pitchfork, a return to the mean is possible.
Conclusion
ASICs continue to drive conversations about the network, both in terms of centralization and increasing power consumption. Network usage and fees remain relatively low with SegWit and Lightning metrics steadily increasing. Exchanges and go-to-market apps continue to be developed.
Technicals suggest ongoing consolidation with several failed bullish reversal attempts, based on Ichimoku Clouds and a longstanding Pitchfork. The structure of price consolidation suggests bullish continuation, which may occur as early as May 31st. If the consolidation results in further downside a bearish target of ~US$5,700 is likely, based on a multi-year Pitchfork.
Author Josh Olszewicz, 21 May 2018
Posted by David Ogden Entrepreneur
Alan Zibluk – Markethive Founding Member
