
Bitcoin price weekly analysis – 11.12.2018
Bitcoin price continued on plummeting throughout last week’s trading sessions, recording a week low of $3,277 last Friday. However, after the week low was recorded, the market began recovering slightly and the bulls managed to push bitcoin price above $3,600 on Sunday. Despite the 14% drop we witnessed last week, the market’s bears failed to pull bitcoin price below $3,192, which represents a critical support level, as per the current market conditions. If bitcoin price continues on recovering during the upcoming week, it won’t face significant resistance except near $4,282, which corresponds to the 76.4% Fibonacci retracement level.
Bitcoin price and the news:
In another disappointing week for cryptocurrency enthusiasts, the price of bitcoin continued on dropping to record a new low during 2018. As such, bitcoin price lost more than 50% of its market capital in less than a month. The bearish wave also affected Ripple (XRP), Stellar (XLM), Ethereum (ETH), EOS, Litecoin (LTC), and Bitcoin Cash (BCH), which witnessed 10-20% price drops during last week’s trading sessions.
Last week, the SEC announced that they are to postpone the ruling of Bitcoin’s ETF until late February. This did not help boost the confidence of crypto investors who seem to be reaching a point of capitulation.
The Bitcoin Network overall hash rate continued on dropping throughout the previous week. Bitcoin’s hash rate has been dropping since the beginning of November, even though it has been steadily rising all through 2018, recording historical highs last August. The reasons behind this decline include:
– Shutting down of mining operations by the Chinese government
– Hash power of mining facilities being redirected away from bitcoin to mine other cryptocurrencies
– Decline of mining profitability forced a considerable percentage of miners to cease mining operations entirely.
Red Ichimoku Cloud on the 1 day BTCUSD chart:
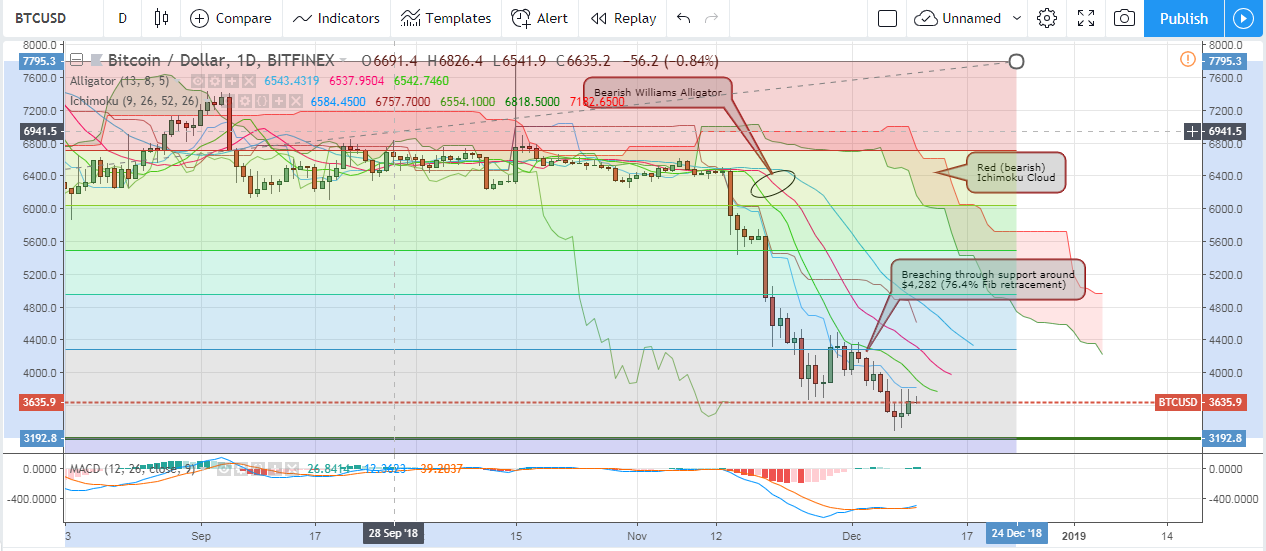
Let’s examine the 1 day BTCUSD chart from Bitfinex, while plotting the Ichimoku Cloud, the Williams Alligator’s SMAs, and the MACD indicator, as shown on the below chart. We can note the following:
– To identify key resistance and support levels as per the current market, we will plot Fibonacci retracements extending between a low of $3,192 and a high of $7,758. Last week, bitcoin price dropped significantly, after the market’s bears managed to breach the support level around $4,282, which corresponds to the 76.4% Fibonacci retracement. Now, the next significant support level lies around $3,192. Last week, bitcoin price began recovering after a low of $3,277 was recorded, which is around $90 higher than the critical support level around $3,192. On the upside, the market’s bulls will face significant resistance around $4,282 (previous support turns into resistance).
– The Ichimoku Cloud is exhibiting multiple bearish signals, which denotes that bitcoin price is most likely to continue on dropping during the upcoming week. The Ichimoku Cloud is red. Bitcoin price is way below the cloud (bearish signal). Also, the Conversion Line (blue line) has crossed below the Base Line (red line), which represents another bearish signal.
– The Williams Alligator’s SMAs are exhibiting a bearish alignment, as the teeth (red SMA) is between the jaw (blue SMA) from above, and the lips (green SMA) from below.
– The MACD indicator is in the negative territory, yet the blue MACD line has crossed above the red signal line.
Bullish reversal signs on the 4 hour BTCUSD chart:
Now, let’s examine the 4 hour BTCUSD chart from Bitfinex, while plotting the Williams Alligator’s SMAs and MACD indicator. We will also keep the Fibonacci retracements we extended on the 1 day chart, as shown on the below chart. We can note the following:
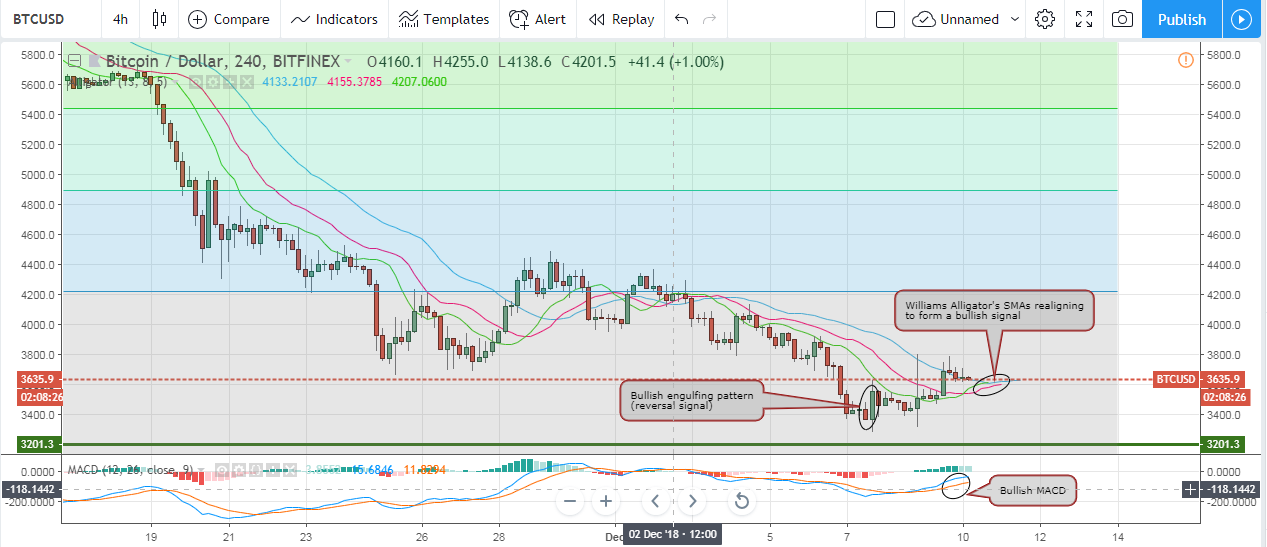
– Right after the week low was recorded, a “bullish engulfing” candlestick pattern was formed on the chart (the pair of candlesticks highlighted by an ellipse on the above chart). This candlestick pattern serves as a bullish reversal signal denoting that bitcoin price can recover and attempt rising towards $4,282 during the upcoming week.
– Even though the Williams Alligator’s SMAs have been exhibiting a bearish alignment since the beginning of December, this alignment began to change on Sunday to form a bullish alignment. This serves as a bullish reversal signal that denotes that the bears are losing their market grip.
– The MACD is bullish. The MACD blue line has crossed above the signal red line and both are sloping in an upwards direction, which represent another bullish reversal signal.
Conclusion:
Bitcoin price continued on dropping during last week’s trading sessions. Even though the 1 day BTCUSD charts are still exhibiting multiple bearish indicators, analysis of the 4 hour BTCUSD charts shows multiple bullish reversal signals that indicate that bitcoin price is likely to recover during the upcoming week.
POSTED BY: TAMER SAMEEH DECEMBER 11, 2018
Alan Zibluk Markethive Founding Member