Bitcoin Price Weekly Analysis – BTC Primed To Test $5,000
Key Points
-
Bitcoin price gained pace recently and broke the $3,580 and $3,780 resistances against the US Dollar.
-
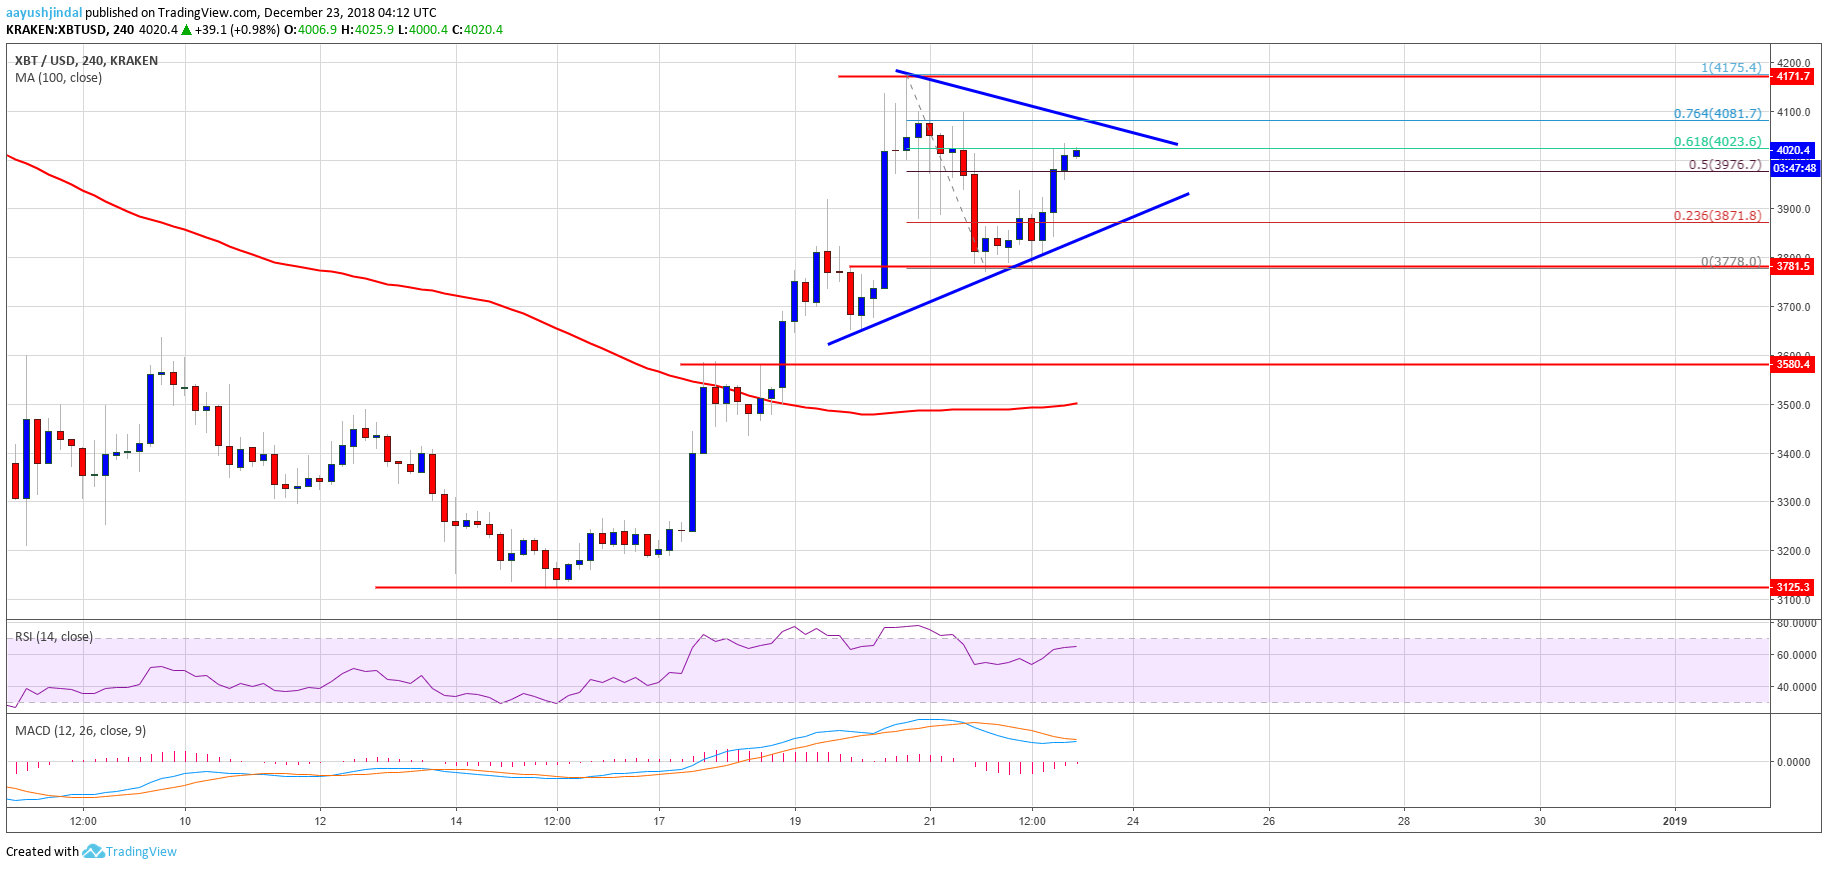
There is a major symmetrical triangle forming with resistance at $4,080 on the 4-hours chart of the BTC/USD pair (data feed from Kraken).
The pair is likely to break the $4,080 and $4,150 resistance levels to rally towards $4,500 or $5,000.
Bitcoin price is placed in an uptrend above $3,580 against the US Dollar. BTC/USD is likely to extend the current bullish wave towards $4,500 or $5,000.
Bitcoin Price Analysis
This past week, bitcoin price started a solid upward move above the $3,200 resistance against the US Dollar. The BTC/USD pair surged above the $3,580 and $3,780 resistance levels. There was even a close above the $3,780 barrier and the 100 simple moving average (4-hours). An intermediate high was formed near $4,175 and recently the price corrected lower. It broke the $3,900 level, but the $3,780 level acted as a solid support.
The price started a fresh upside and broke the $3,900 resistance. It even broke the 50% Fib retracement level of the recent decline from the $4,175 high to $3,778 low. More importantly, there is a major symmetrical triangle forming with resistance at $4,080 on the 4-hours chart of the BTC/USD pair. The triangle seems to be a bullish continuation pattern towards the $4,175 and $4,300 levels. A successful break above the $4,100 and $4,150 levels is needed for further gains. Once there is a break above $4,175, the price could rally towards $4,500 or $5,000.

Looking at the chart, BTC price remains well supported on dips near the $3,900 and $3,780 levels. As long as there is no close above the $3,580 pivot, the price is likely to surge towards $4,200, $4,500 or even $5,000.
Looking at the technical indicators:
4-hours MACD – The MACD for BTC/USD is about to move into the bullish zone.
4-hours RSI (Relative Strength Index) – The RSI is well above the 60 level.
Major Support Level – $3,780
Major Resistance Level – $4,175
AAYUSH JINDAL | DECEMBER 23, 2018 | 5:00 AM
Alan Zibluk Markethive Founding Member
