Bitcoin Hovers Near $8,000 Level as Investors Weigh Twitter Ban

Bitcoin Hovers Near $8,000 Level as Investors Weigh Twitter Ban

Bitcoin Hovers Near $8,000 Level as Investors Weigh Twitter Ban

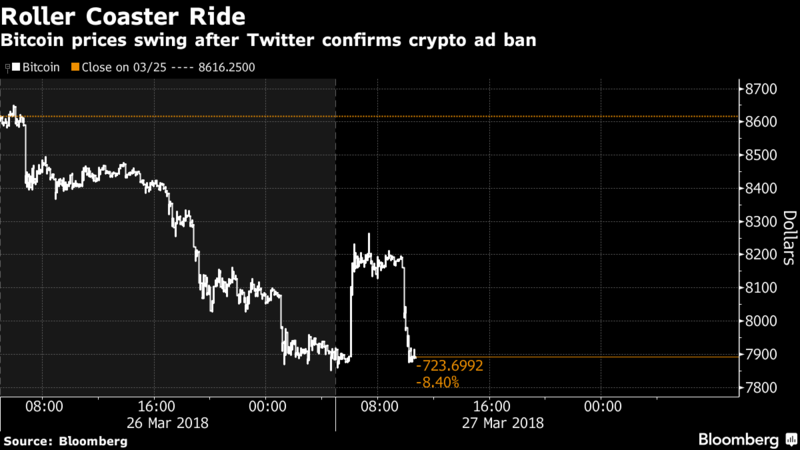
Bitcoin swung between gains and losses near the $8,000 level, paring an earlier rebound, as investors digested the decision by Twitter Inc. to ban advertisements for initial coin offerings and token sales on its service.

The largest cryptocurrency traded flat at $7,847.87 as of 11 a.m. in Hong Kong, according to consolidated Bloomberg pricing. The digital currency had earlier jumped as much as 4.8 percent, reversing an overnight decline that took Bitcoin down to about $7,850. Rival coins Ripple, Ether and Litecoin also erased gains. Bitcoin remains down 25 percent in March.

Twitter confirmed Monday it’s banning the advertisements on its platform due to concern the content is often related to deception and fraud, according to a company spokesperson. The decision comes after Facebook Inc. banned cryptocurrency ads in January and Alphabet Inc.’s Google said it would do the same starting in June.

Since Bitcoin reached a peak of almost $20,000 in mid-December at the height of the cryptocurrency frenzy, the digital currency has lost more than half of its value as investors weigh the future of the emerging space amid intensifying scrutiny from global regulators.

Cboe Global Markets Inc., which was the first U.S. exchange to list Bitcoin futures last year, continues to have plans to introduce more cryptocurrency-related products. The exchange operator prodded U.S. securities regulators Monday to consider approving crypto exchange-traded funds in a letter to the Securities and Exchange Commission.


Author Eric Lamb

Updated on 27 March 2018, 04:04 BST


Posted By David Ogden Entrepreneur
David Ogden Cyrptocurrency Entrepreneur

Alan Zibluk – Markethive Founding Member

Bitcoin, Ethereum, And Litecoin Are The Most Popular Cryptocurrency Investments Among Millennials

Bitcoin, Ethereum, And Litecoin Are The Most Popular Cryptocurrency Investments Among Millennials

Bitcoin, Ethereum, And Litecoin Are The Most Popular Cryptocurrency Investments Among Millennials


Millennials love cryptocurrencies. For a couple of reasons. One of them is the technology behind them that promises to modernize capitalism, and free it from the tight control of big governments and big banks. The other reason is the potential cryptocurrencies have to make investors rich quickly, provided that they continue to rise at an astronomical pace.

That’s why, among millennials, cryptocurrencies were a popular choice to invest $10,000 in, in a recent survey of 1000 Americans.

Specifically, the survey found that 9.19% of millennials (18-34) would invest the $10,000 in cryptocurrencies, compared to 4.04% of Generation Xers (35-54), and (3.08%) of Baby Boomers (55+).

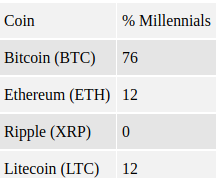
What’s more interesting is that Bitcoin remains by far the most popular choice, followed by Ethereum, and Litecoin. Specifically, 76% of the millennials in the survey said that they would invest the $10,000 in Bitcoin, 12% in Ethereum, and 12% in Litecoin—see table 1.


Table1


In Which Cryptocurrencies Millennials Will Invest $10,000

Source: LendEDU

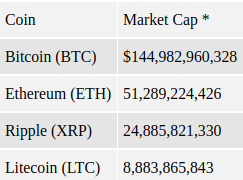
To a great extent, the survey results are as one might have expected. The survey rankings of major cryptocurrencies match their market capitalization rankings—see table 2. The only exception is Ripple, which is third in market capitalization, and nowhere to be found in the survey rankings.

That means Litecoin is more popular than Ripple.

Table 2

Cryptocurrencies by Market Capitalization

*As of Sunday March 25, 2018, at 11 a.m

Source: Coinranking.com
 

There are a couple explanations for that. One of them is that the survey sample is extremely small, and therefore could easily have missed those who could invest the $10,000 in Ripple. Another answer is that the rise of Ripple in market capitalization is fairly recent, and therefore has yet to capture the attention of the average millennial investor.


Contributor Panos Mourdoukoutas


Posted by David Ogden Entrepreneur
David Ogden Cryptocurrency Entrepreneur

Alan Zibluk – Markethive Founding Member

Bitcoin Cash Price Weekly Analysis – BCH/USD Struggling to Recover

Bitcoin Cash Price Weekly Analysis – BCH/USD Struggling to Recover

Key Points

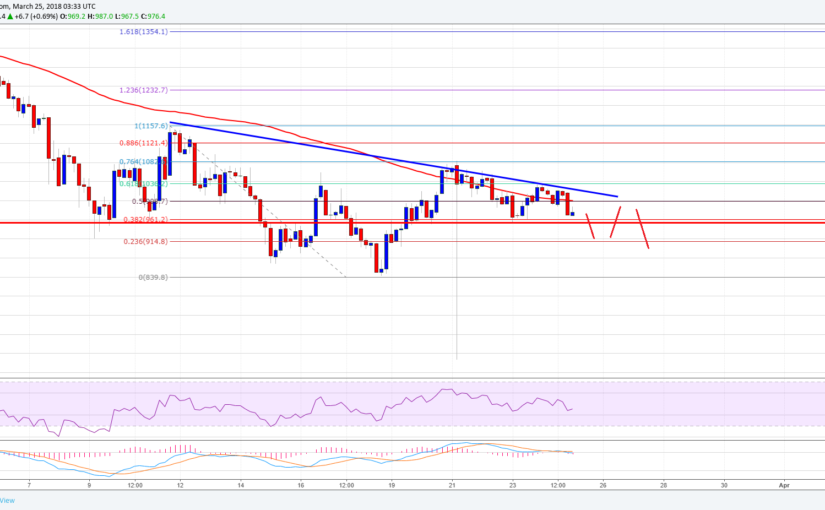
Bitcoin cash price corrected higher but it struggled to move above the $1,080-1,100 against the US Dollar.

There is a significant bearish trend line forming with resistance at $1,000 on the 4-hours chart of the BCH/USD pair (data feed from SimpleFX).

The pair may continue to struggle and it could decline below the $950 support in the near term.

Bitcoin cash price is struggling to gain upside momentum against the US Dollar. BCH/USD remains at a risk of more losses below the $950 support.
 

Bitcoin Cash Price Resistance

There was a minor upside recovery initiated in bitcoin cash price from the $640 swing low against the US Dollar. The price recovered above the $800 resistance and the 50% Fib retracement level of the last drop from the $1,157 high to $640 swing low. Moreover, there was a break above the $1,000 level and the $1,020 pivot level. However, the price faced a lot of sellers near the $1,080 and $1,100 resistance levels.


More importantly, a significant bearish trend line with resistance at $1,000 on the 4-hours chart of the BCH/USD pair also acted as a hurdle. Lastly, the price failed to move above the 76.4% Fib retracement level of the last drop from the $1,157 high to $640 swing low. At the moment, the price is moving lower and is trading below the $1,000 level and the 100 simple moving average (4-hours). As long as the price is below the $1,000 level and the 100 SMA, it remains at a risk.

On the downside, the $950 level is a crucial support. If the price drops below the mentioned $950 support, it could move back in the bearish zone in the near term.


Looking at the technical indicators:
 

4-hours MACD – The MACD for BCH/USD is moving back in the bearish zone.

4-hours RSI (Relative Strength Index) – The RSI for BTC/USD is now well below the 50 level.

Major Support Level – $950

Major Resistance Level – $1,000


Author AAYUSH JINDAL •  MAR 25, 2018 • 04:03

Posted by David Ogden Entrepreneur

Alan Zibluk – Markethive Founding Member

Reddit Reportedly Removes Bitcoin As Payment, Cites ‘Coinbase Change’

Reddit Reportedly Removes Bitcoin As Payment, Cites ‘Coinbase Change'

Twee

Reddit Reportedly Removes Bitcoin As Payment, Cites ‘Coinbase Change’

Reddit has reportedly removed the option for users to pay for their premium membership program, Reddit Gold, in Bitcoin (BTC) citing an “upcoming Coinbase change”, according to a Reddit post in subreddit /r/btc published March 23.

Reddit user BitcoinXio posted a video of the steps to give another user Reddit Gold, showing that the only payment options are PayPal and credit card.

Reddit user emoney40, a moderator of several subreddits but not /r/btc, commented that the change is due to the Coinbase Commerce change:

“The upcoming Coinbase change, combined with some bugs around the Bitcoin payment option that were affecting purchases for certain users, led us to remove Bitcoin as a payment option.”

Coinbase posted on its Medium page in early March 2018 about retiring Coinbase Merchant Tools in place of Coinbase Commerce, which they acknowledged “may be disruptive to Coinbase Merchant Tool customers.” As of April 30, merchants that used Coinbase Merchant Tools will no longer have access to that product, with May 31 as the final date for the required switch to Coinbase Commerce.

User emoney40 also said that adding BTC back as a payment option is not a guarantee:

“We're going to take a look at demand and watch the progression of Coinbase Commerce before making a decision on whether to reenable.”

Some Reddit users on the thread commented that they were not using BTC to pay for Reddit Gold anyway, due to the high transaction fees. However, in February BTC transaction fees dipped below the price of Bitcoin Cash (BCH) fees, which had been one of the main talking points of BTC’s competitors.


Author Molly Jane Zuckerman


Posted by David Ogden Entrepreneur

Alan Zibluk – Markethive Founding Member

Bitcoin Price Technical Analysis for 23rd Mar 2018 – Another Reversal Pattern

Bitcoin Price Technical Analysis for 23 Mar 2018 – Another Reversal Pattern

Bitcoin Price Technical Analysis for 03/23/2018 – Another Reversal Pattern

Bitcoin Price Key Highlights


Bitcoin price failed to break past the $9,000 level after news of a potential shutdown of Binance in Japan broke out.

However, bitcoin price could still form an inverse head and shoulders pattern, which is a potent reversal signal.

Technical indicators are showing that bullish momentum could stay in play.

Bitcoin price sold off recently but could form a short-term reversal pattern on its 1-hour time frame and draw more buyers back in.
 

Technical Indicators Signals


The 100 SMA just crossed above the longer-term 200 SMA to signal that buyers are gaining the upper hand. The 200 SMA is also holding as dynamic support at the moment, but a break lower could lead to another pickup in selling pressure.


Stochastic is pointing down to show that bears have the upper hand while RSI is turning lower as well. Both oscillators are nearing oversold conditions, though, so sellers could still let buyers take over soon.


An area of interest is located around $8,000 and a bounce from here could form the right shoulder of the reversal pattern. Bitcoin price has yet to break past the neckline around $9,200 to confirm a potential uptrend. This should last by around $2,000 or the same height as the chart formation.

Bitcoin Price Key Highlights


Bitcoin price failed to break past the $9,000 level after news of a potential shutdown of Binance in Japan broke out.

However, bitcoin price could still form an inverse head and shoulders pattern, which is a potent reversal signal.

Technical indicators are showing that bullish momentum could stay in play.

Bitcoin price sold off recently but could form a short-term reversal pattern on its 1-hour time frame and draw more buyers back in.


Technical Indicators Signals


The 100 SMA just crossed above the longer-term 200 SMA to signal that buyers are gaining the upper hand. The 200 SMA is also holding as dynamic support at the moment, but a break lower could lead to another pickup in selling pressure.


Stochastic is pointing down to show that bears have the upper hand while RSI is turning lower as well. Both oscillators are nearing oversold conditions, though, so sellers could still let buyers take over soon.


An area of interest is located around $8,000 and a bounce from here could form the right shoulder of the reversal pattern. Bitcoin price has yet to break past the neckline around $9,200 to confirm a potential uptrend. This should last by around $2,000 or the same height as the chart formation.


Author: SARAH JENN • MAR 23, 2018 • 04:03


Posted by David Ogden Entrepreneur

Alan Zibluk – Markethive Founding Member

Bitcoin, Ethereum, Bitcoin Cash, Ripple, Stellar, Litecoin, Cardano, NEO, EOS – Price Analysis, March 21

Bitcoin, Ethereum, Bitcoin Cash, Ripple, Stellar, Litecoin, Cardano, NEO, EOS - Price Analysis, March 21

Bitcoin, Ethereum, Bitcoin Cash, Ripple, Stellar, Litecoin, Cardano, NEO, EOS – Price Analysis, March 21

The G20 considers cryptocurrencies risky, said the head of Italy’s central bank, but the broad consensus is that they should not be banned. After days of negative news, this is a positive shift for the cryptomarket. Led by Bitcoin, most cryptocurrencies are trying to pull back from their recent lows.

The plunge in cryptocurrencies from their December highs had scared off new wannabe cryptocurrency investors. Once the tide turns, we may see fresh money trickle back into the markets.

A recent survey by Finder.com shows that only 8 percent of the Americans own cryptocurrencies and another 8 percent plan to buy it in the future. With about 92 percent of the population still untapped, the markets have a long way to go. There is still enough skepticism and fear due to the huge volatile moves in the digital currencies. However, if traders plan properly, the risks are way less than made out to be.

Let’s watch the setups that are developing on the top coins.
 

BTC/USD

Bitcoin broke out of the descending channel on March 20, which is a bullish sign. It had broken out once earlier on March 02, but it could not sustain the higher levels. Within six days, the price was back inside the channel. Will the same thing repeat again?
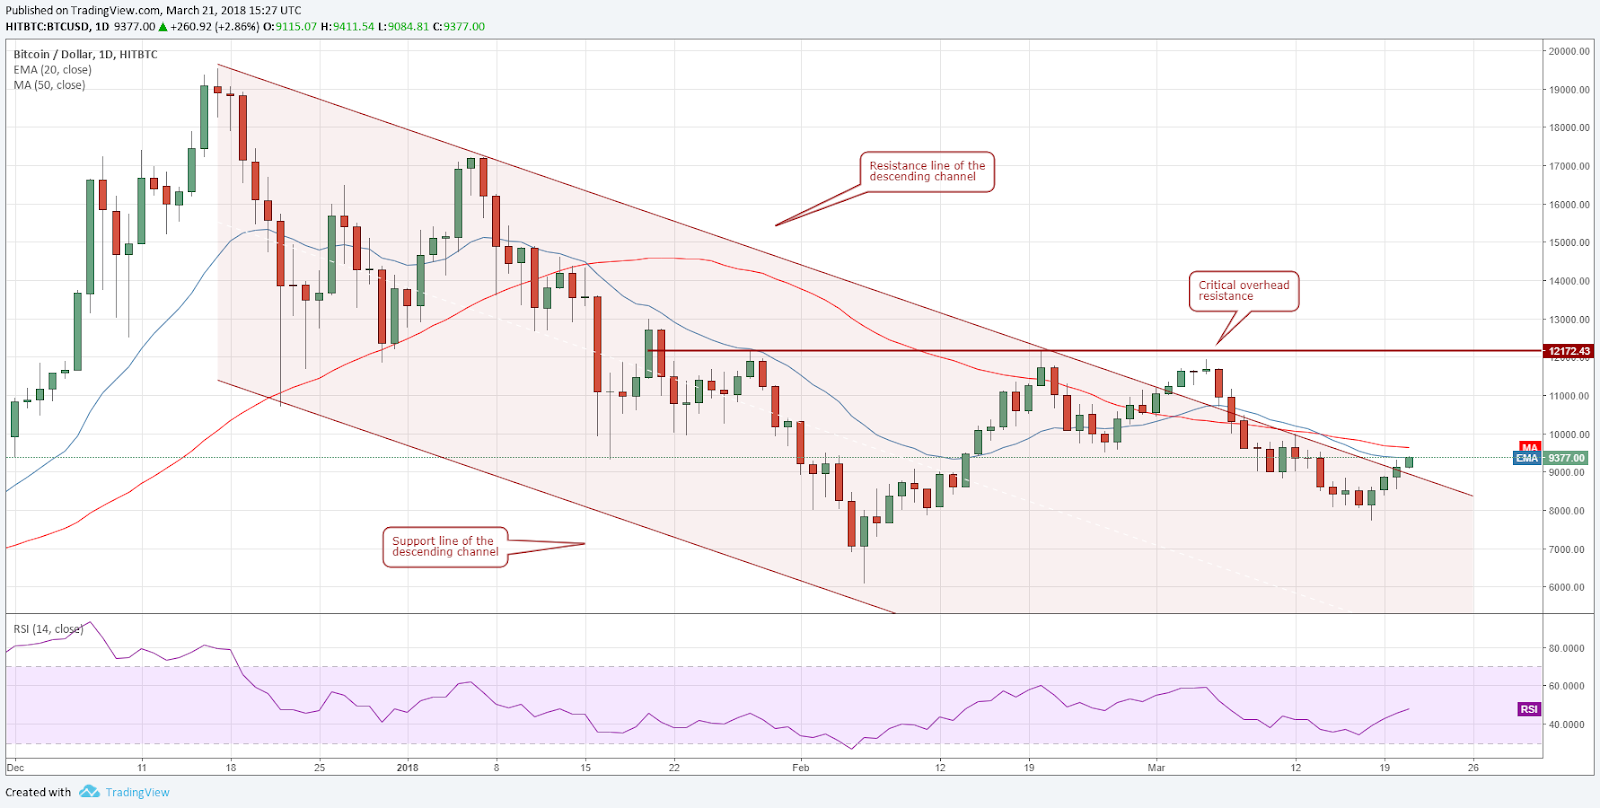
Just above the resistance line of the descending channel are resistances from the 20-day EMA and the 50-day SMA. We expect the bears to strongly defend this zone because once the price breaks out of this, the BTC/USD pair will rally to $12,172.

The next dip towards the $8,800 levels should offer the traders a good entry opportunity. They should purchase 50 percent of the desired allocation around $8,800 with a stop loss of $7,600. The remainder of the position can be added once the cryptocurrency is clear of both moving averages.

The target objective on the upside is a rally to $12,000.


ETH/USD

Ethereum is trying to break out of the descending channel (marked 2 on the chart) and the overhead horizontal resistance at $565.54. If successful, we’ll see a rally to the 20-day EMA at $650, which will most likely trigger bears selling.
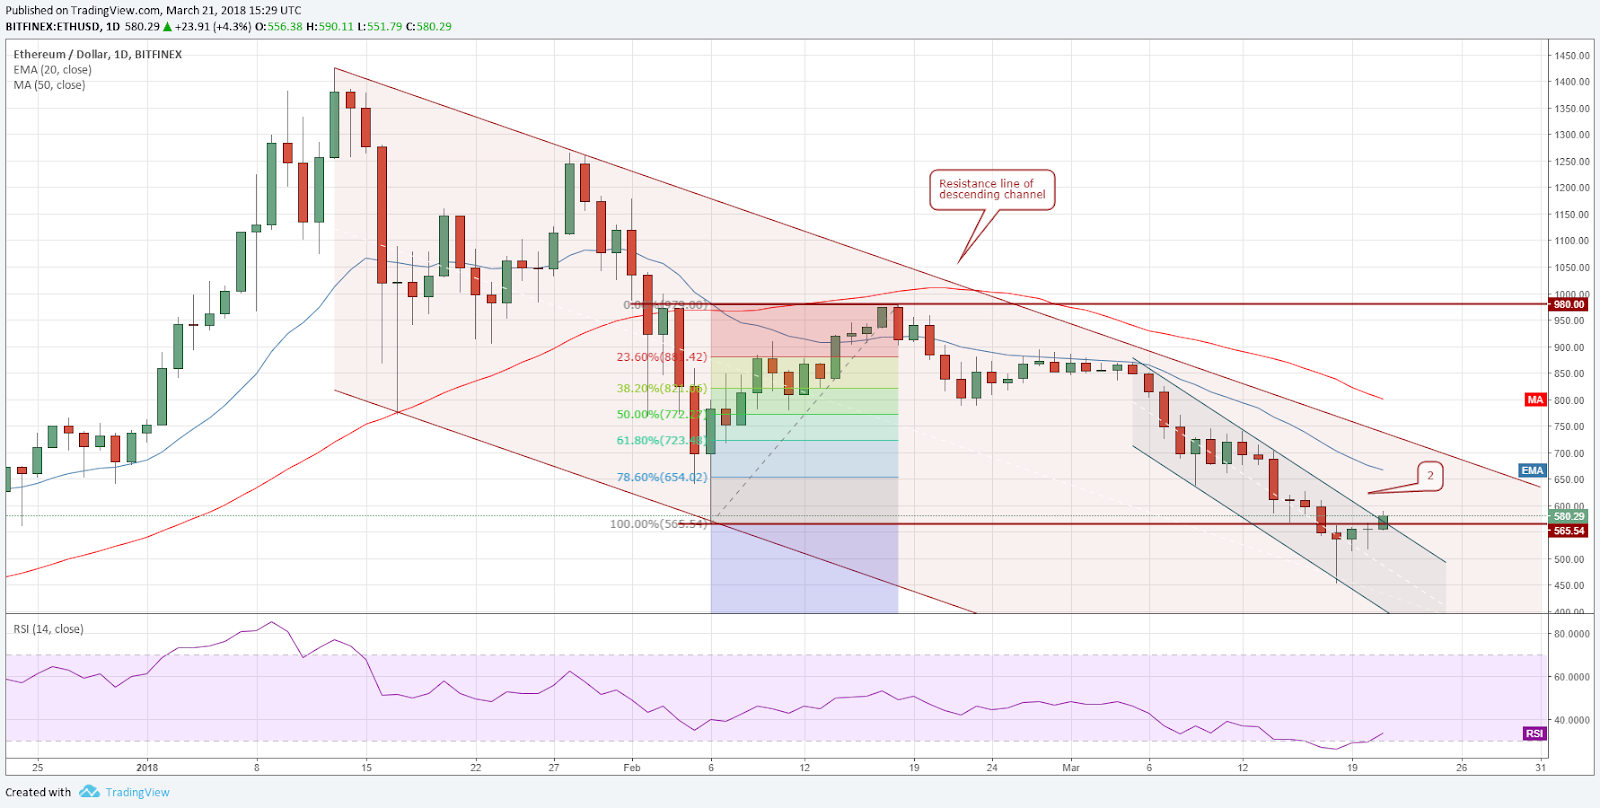
Above the 20-day EMA, the resistance line of the descending channel and the 50-day SMA are the other two significant resistance levels.

Aggressive traders can buy if the price closes above $575 (in the UTC time frame). The initial stop loss can be placed at $500. If the cryptocurrency struggles to break out of $660, the positions can be closed.

On the contrary, if the ETH/USD pair turns back below $565, it will become weak, and the price will experience a retest of the recent lows.
 

BCH/USD

Bitcoin Cash has broken out of the downtrend line and is currently trying to move above the 20-day EMA. There are a number of resistances between $1,100 to $1,200.
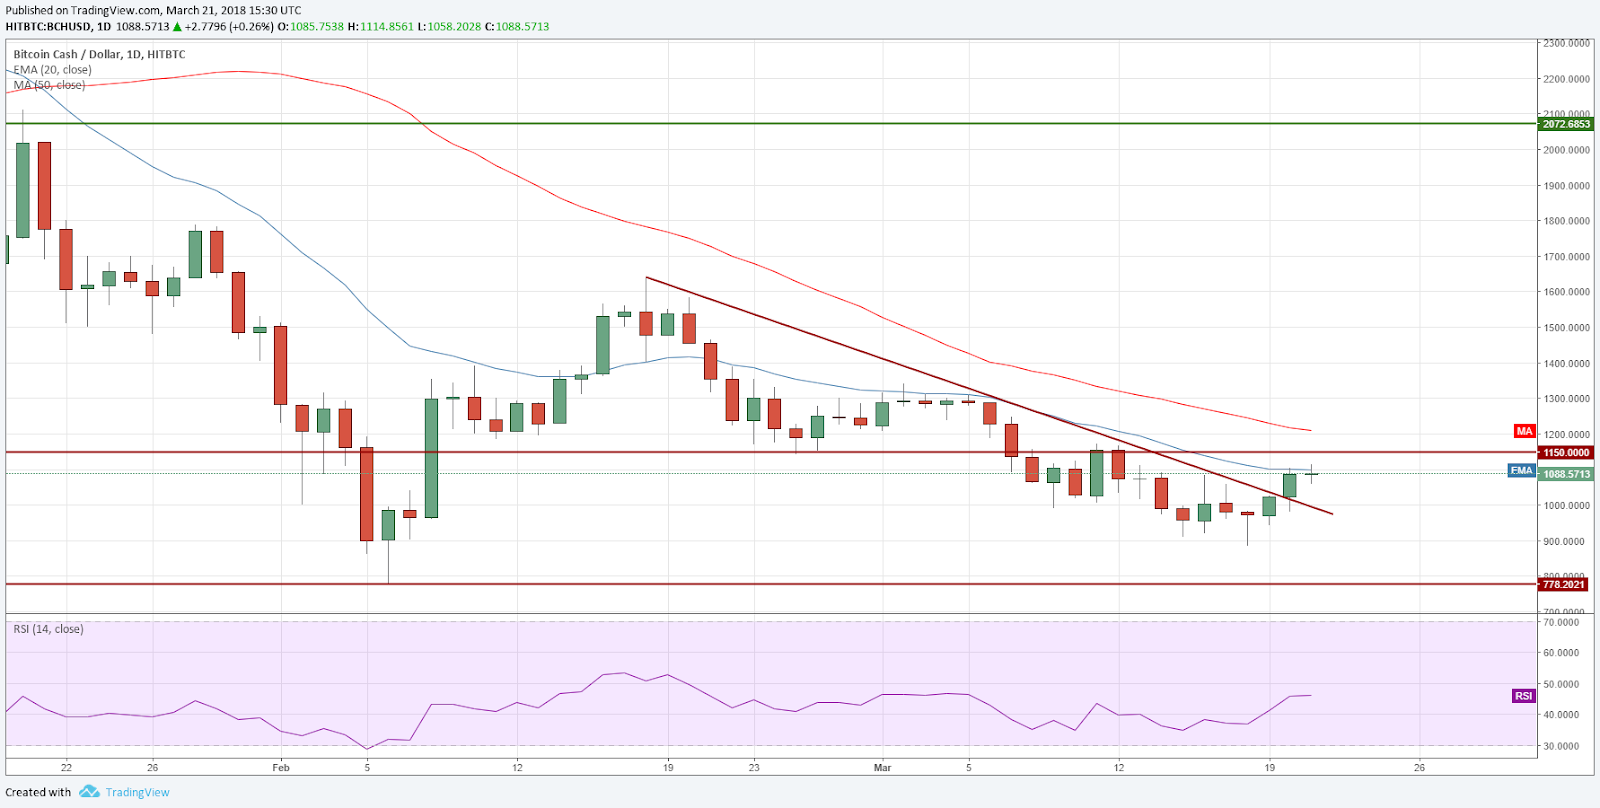
Currently, the cryptocurrency remains in a downtrend, as both moving averages are falling and the price is still below them. Once it sustains above $1,200, we can expect the BCH/USD pair to attract buyers and rally towards $1,600. We should wait for Bitcoin Cash to break out of the 50-day SMA before suggesting any trades.

On the downside, $980 and $880 will act as strong support on declines.
 

XRP/USD

In our previous analysis, we had recommended a long position for Ripple at $0.71, which got filled on March 19. The stop loss for the trade is $0.53, which is just below the low on March 18.
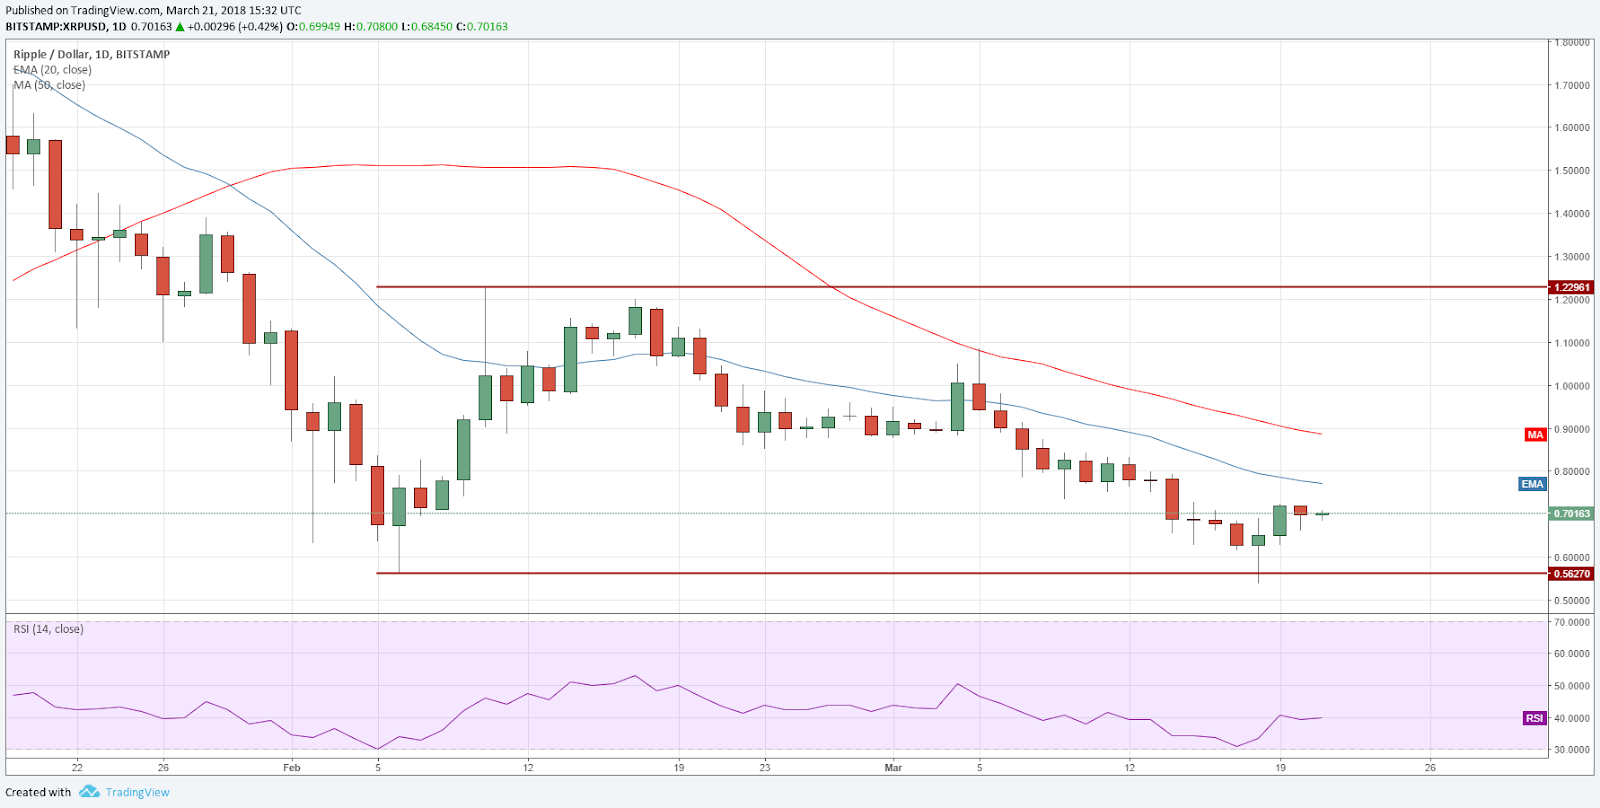
On March 20, the XRP/USD pair formed an inside day candlestick pattern. The range has shrunk again today, showing indecision between the bulls and the bears.

If the consolidation of the past two days breaks out of $0.73, the pullback will gain strength.

On the upside, the bears will pose a stiff challenge in the zone between the 20-day EMA and the 50-day SMA. Once the price breaks out of the $0.9 levels, the cryptocurrency should rally to $1.1 and then to the upper end of the $1.2 range.

We need to close the position if the price struggles to break out of any of the above-mentioned resistances.
 

XLM/USD

Stellar has pulled back from the lows of $0.2 to the 20-day EMA. It has broken out of the downtrend line meanwhile, which confirms that the negative momentum is weakening.
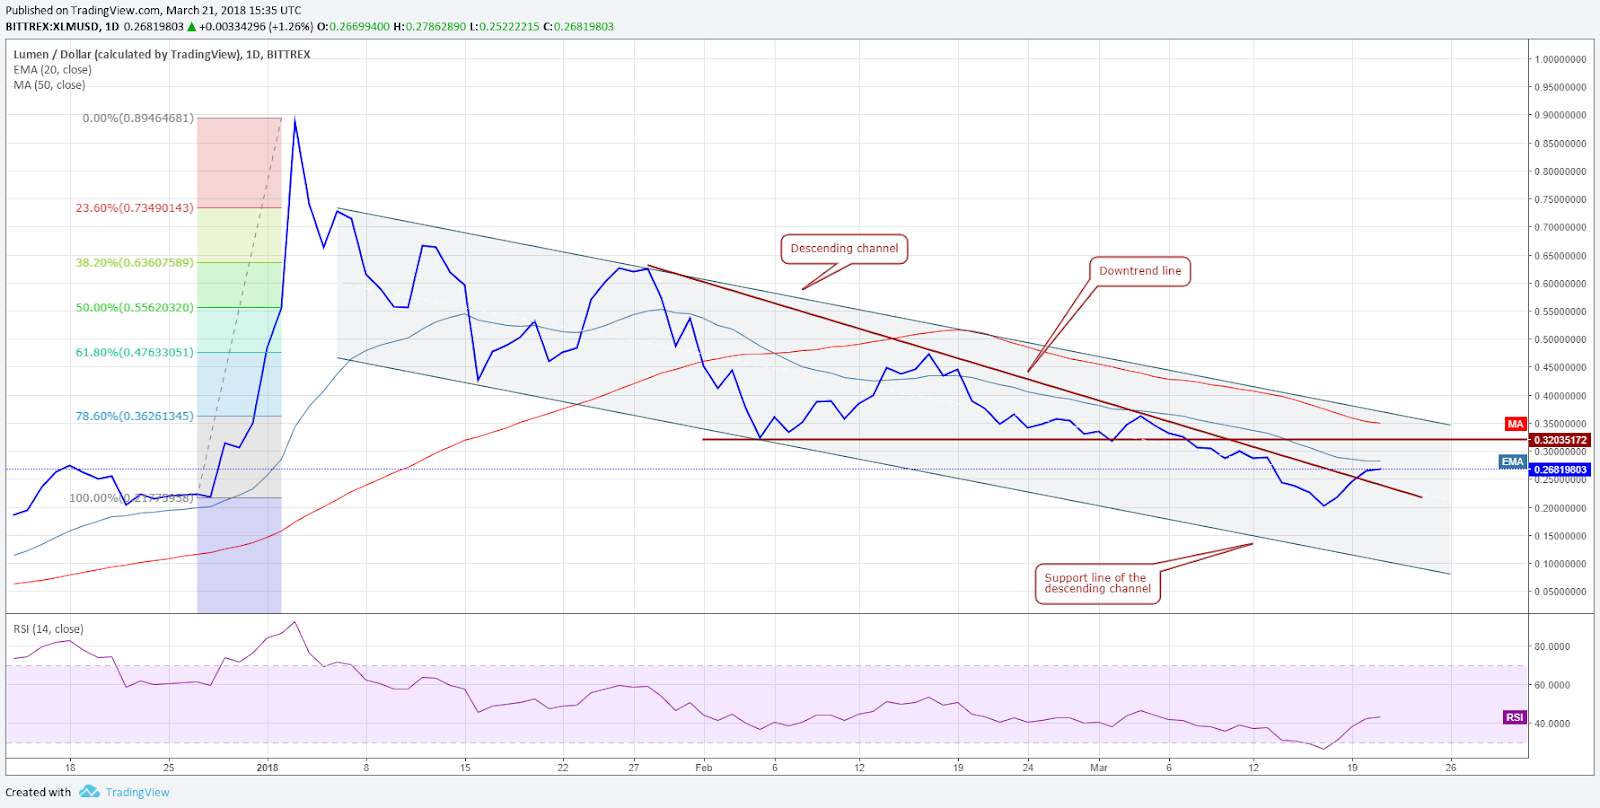
Still, the bears will try to defend the 20-day EMA. If the bulls purchase the subsequent dip around the $0.23 mark, it will offer the traders an opportunity to initiate long positions. We are suggestingan aggressive trade on the XLM/USD pair because we find that the 20-day EMA, the resistance line of the descending channel and the 50-day SMA have not offered a strong resistance previously.

The position can be covered if the daily close (UTC) is below $0.18. On the upside, we can expect a rally to $0.35. If this level is crossed, a move to $0.47 can’t be ruled out.
 

LTC/USD

Litecoin looks strong as it has pulled back smartly from the lows of $144.544. It has broken out of the downtrend line, which is a positive sign. The current recovery might face a stiff resistance between the 20-day EMA and $187. We need to wait for the next dip to initiate long positions.
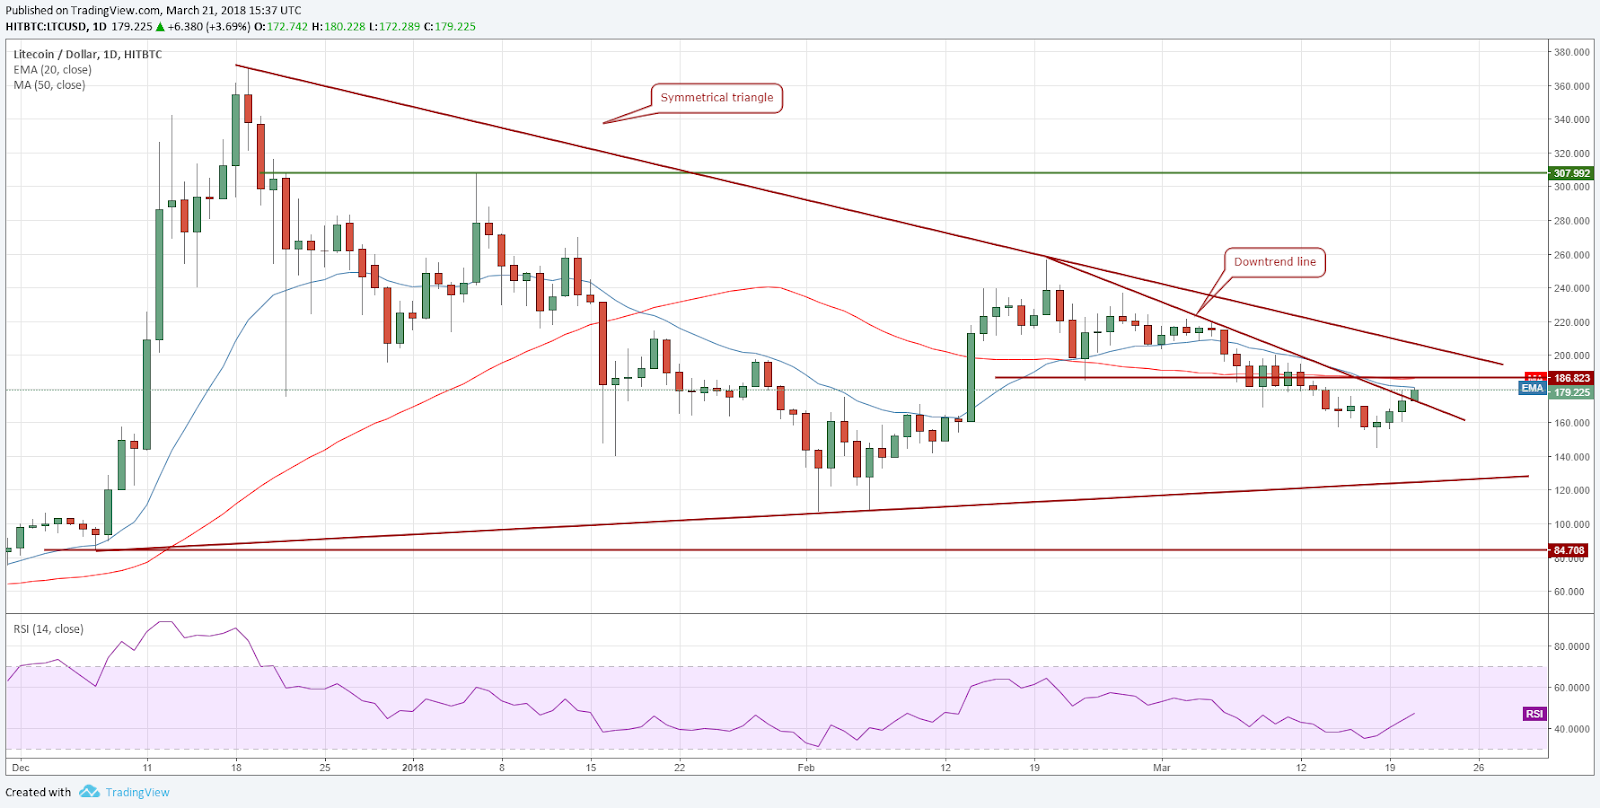
We find a large symmetrical triangle formation on the LTC/USD pair, which will break out above $205. Though the target objective is way higher, we can trade it for an up move to $240 and after that to $300.

Two possibilities are developing. Either buy on a dip towards $165 with a $142 stop loss or wait for a breakout above $205 to enter long positions with a stop loss at $180.


ADA/BTC

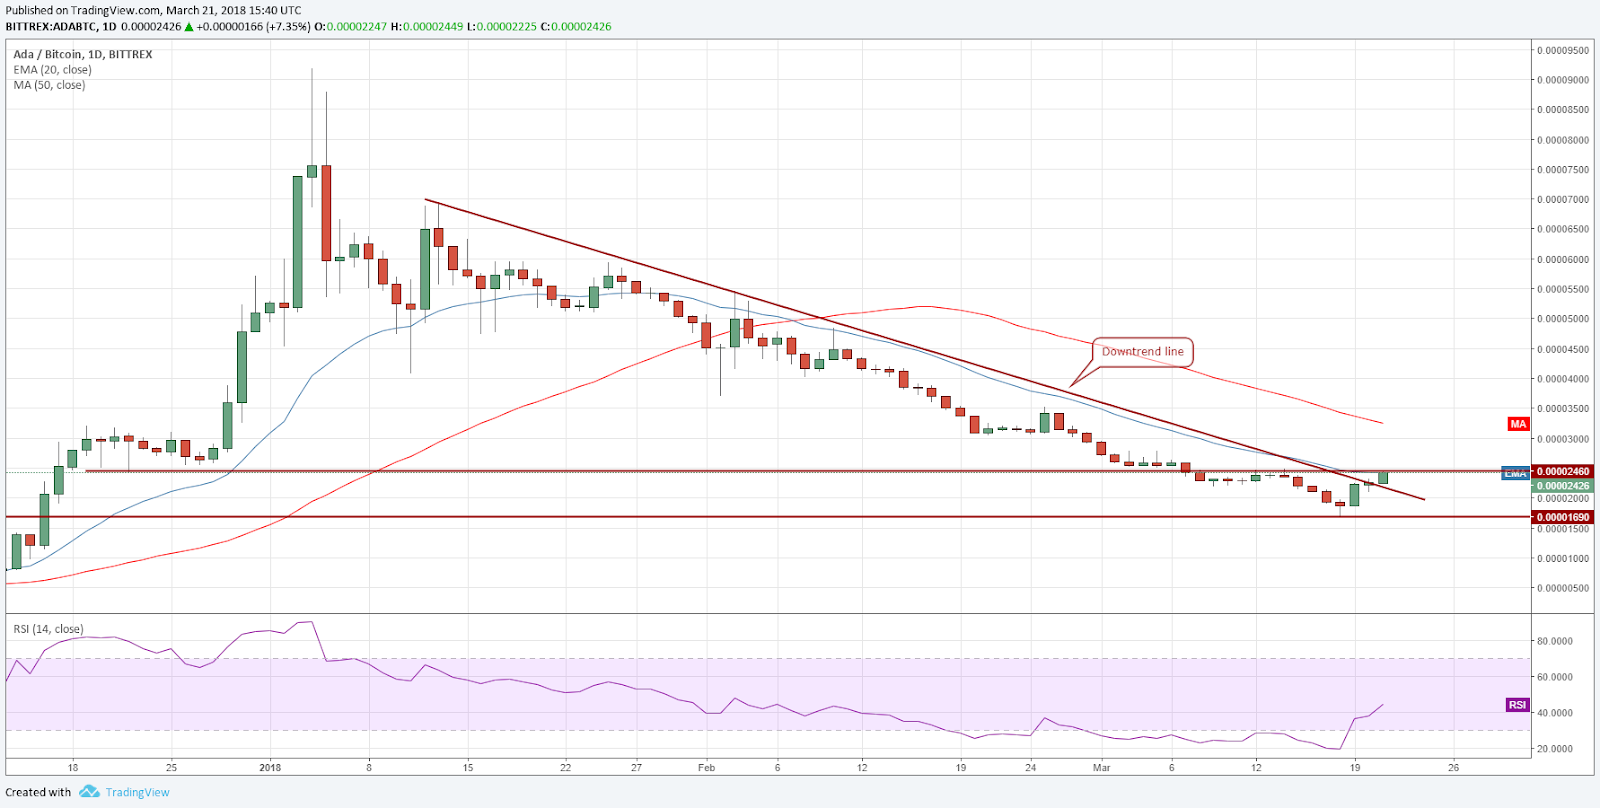
Cardano has broken out of the downtrend line for the first time since January this year. This is a major development as it shows that the trend is changing.
700

Right now, the ADA/BTC pair is facing resistance at 0.00002460. Once the bulls clear this resistance, a move to 0.000035 is possible.

Therefore, we suggest long positions if the price sustains at 0.000025 levels for four hours. The stop loss can be kept at 0.000016.
 

NEO/USD

NEO has pulled back sharply from its recent lows of $49.04. This shows that the markets have rejected the breakdown and the lower levels. We expect a stiff resistance at the $86 levels.
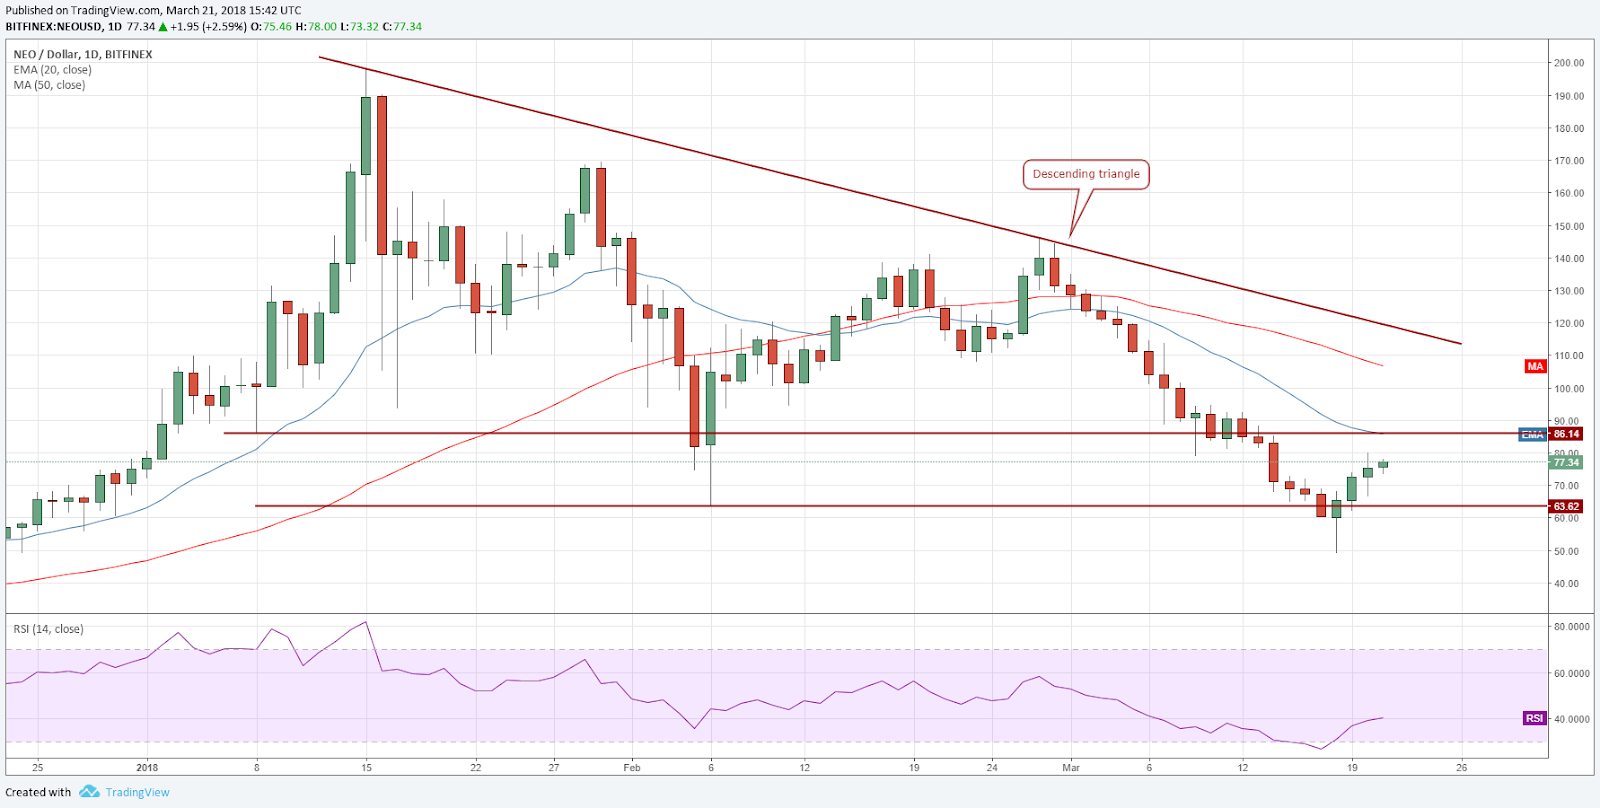
If the NEO/USD pair finds support at the $65 mark during the next dip, it will signal a bottom formation and can be purchased with a stop below $48.

But if the price continues to march higher, then $90 is a good level to enter long positions with an initial stop loss of $70, which can be raised later. Our first target objective is a move to $115, where we anticipate selling. If NEO breaks out of $120, the momentum should pick up and push prices towards $140 levels.
 

EOS/USD

EOS has risen sharply from its lows of $3.8723. For the past two days, it is facing selling at the 20-day EMA, but it has not given up much ground, which is a positive indication.
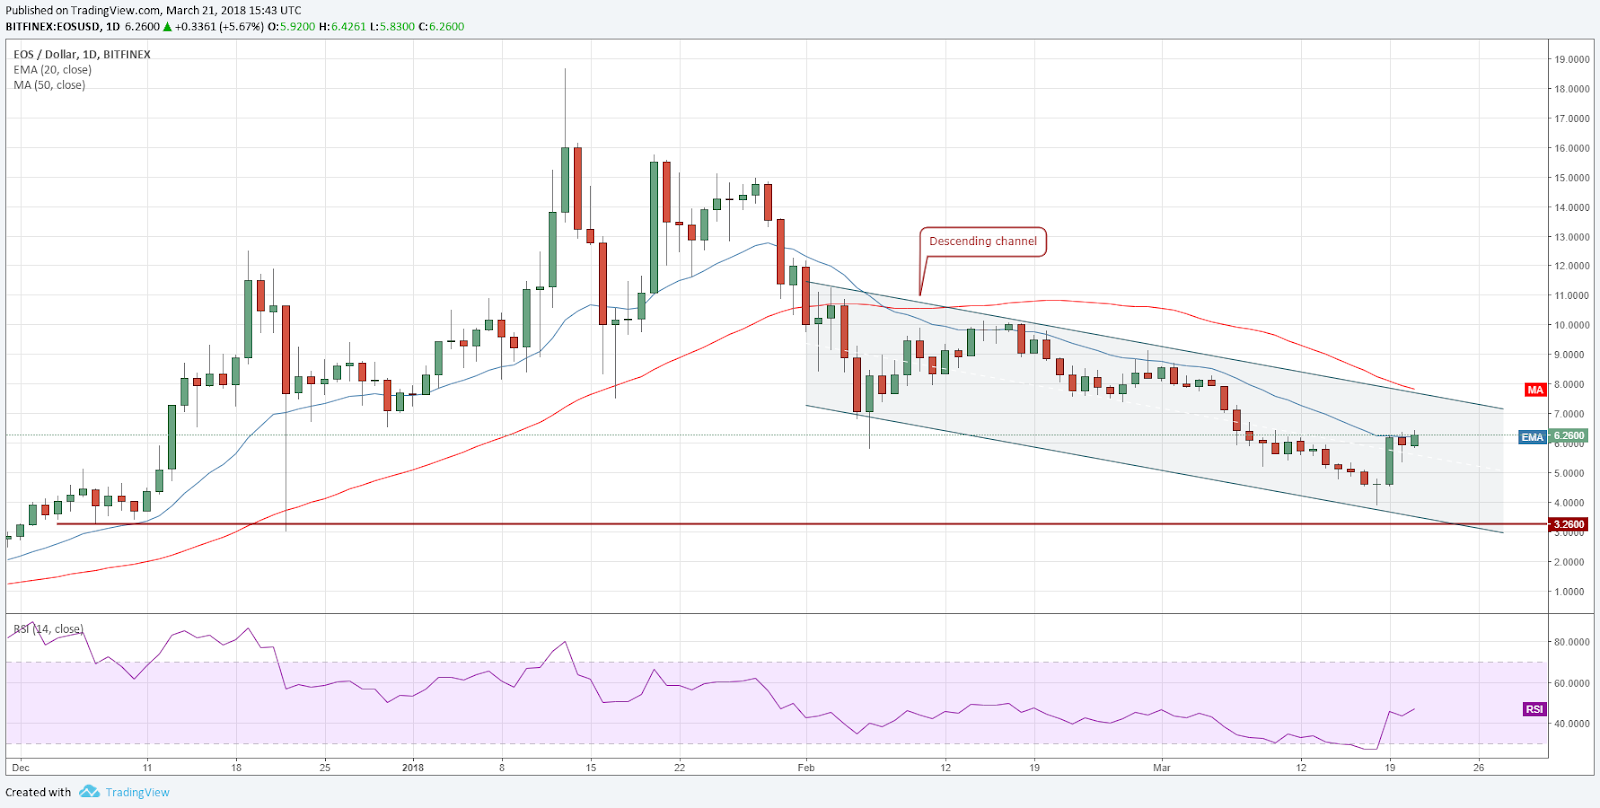
If the EOS/USD pair rallies above $6.3, it should move up to the resistance line of the descending channel.

Prices have turned down from the channel line on two previous occasions, hence, this will act as a stiff resistance. At the moment, we don’t have an attractive risk to reward ratio, that’s why we don’t recommend making any trades on it.


Author: Rakesh Upadhyay


Posted by David Ogden Entrepreneur


Alan Zibluk – Markethive Founding Member

Bitcoin Price Breaks $9,000, Does Not Stay For Long

Bitcoin Price Breaks $9,000, Does Not  Stay For Long

Bitcoin Price Breaks $9,000, Does Not Stay For Long

March 20: the Bitcoin (BTC) price broke the $9,000 mark today after a rough start to the year in which the price decreased by nearly 70 percent from the December high of $20,000.

Following the December high the BTC price has moved downward in fits and starts. On January 17, BTC price was down to $9,724, less than half of where it had been a month previously when it scraped the underside of $20,000. The month of February started with BTC dipping below $9,000 for the first time since late Nov. 2017.

By February the price had sunk to just $5,922, with skeptics claiming that it could sink even lower. By late February and early March, BTC was fluctuating around the $9,000 mark, with changes spurred by news of new regulations on exchanges by the US Securities and Exchange Commission (SEC).

A return to prices above $9,000 would provide the confidence many traders and investors need for the BTC value to grow even further.

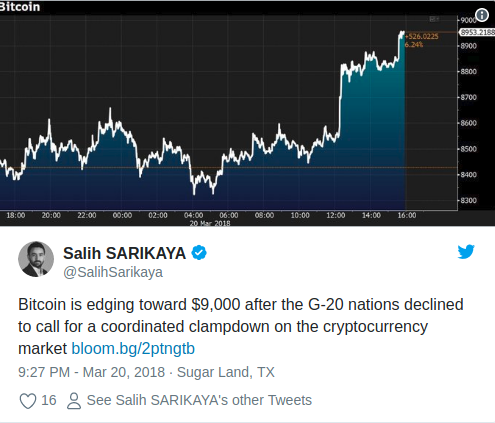
As Cointelegraph reported March 20, the G20 decided not to crack down on cryptocurrency, and opted for a more moderate approach of simply classifying cryptocurrencies as assets. Some see this as a possible cause for crossing the $9,000 psychological threshold.

Others are more skeptical that the results will be long lasting, and see the most recent bump above $9,000 to be part of a holding pattern that requires another, stronger increase in order to break the barrier.

At press time, Bitcoin was trading at $9,017
 

Author: Salih SARIKAYA


Posted by David Ogden Entrepreneur

Alan Zibluk – Markethive Founding Member
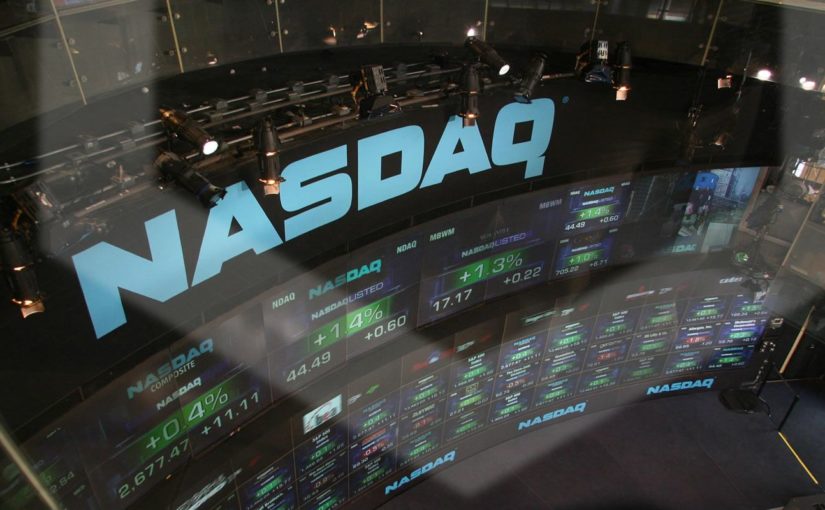
Bitcoin Following Nasdaq Path but 15 Times Faster

Bitcoin Following Nasdaq Path but 15 Times Faster

Bitcoin Following Nasdaq Path but 15 Times Faster

Morgan Stanley put out a note to its clients on Monday the 19th breaking down Bitcoin trading in comparison to the Nasdaq during the dot-com crash 20 years ago.

Bitcoin Similar to Dot-Coms Through Bear Markets

According to the report, Bitcoin is behaving very similar to the way the Nasdaq did in 2000. There is parity in the pattern of price declines and the rally of 250 -280 percent “in their most exuberant period” just before the bear market.

“Just that the bitcoin rally was around 15 times the speed,” Sheena Shah, strategist at Morgan Stanley said.

There have been four bear markets with Bitcoin since 2009 and through each, the cryptocurrency has lost between 28 and 92 percent of its value. It lost 70% of its value from it’s $20,000 high mark in December to $7,000 in February before recovering slightly to where it is today over $8,000. Averaging a loss of between 40-50% of its value through each bear market is similar to the Nasdaq’s performance 18 years ago Shah said.

According to the Morgan Stanely report trading volume can also be seen as a red flag. The Bitcoin trading volume has jumped nearly 300% since the market decline in December but each rally saw volumes fall ahead of the bear market to come. Shah said regarding the trading volumes;

“The follow-up rally for both bitcoin and the Nasdaq always saw falling trading volumes. Rising trade volumes are thus not an indication of more investor activity but instead a rush to get out.”
 

Tethers Effect on Market Trading

The Morgan Stanley report continued to point out the effect that the Tether cryptocurrency may have had on market trading. Citing that during the latest bear market the Tether USDT coin which is purportedly backed up one to one with US Dollars took up a bigger share of Bitcoin trading compared to the three historically major trading currencies; US Dollar, Chinese Yuan and the Japanese Yen.

“The coin USDT is not a major funding unit but its increasing use is an interesting development,” Shah wrote. “Over the coming years, we think that market focus could turn increasingly towards cross trades between cryptocurrencies/tokens, which would transact via distributed ledgers only and not via the banking system.”

Bloomberg reported in January that Tether has been subpoenaed by the US commodities trading commission under speculation that they do not hold the $2.2 billion in reserve in order to back their token. Bitcoin’s price continues to vacillate around the $8,000 mark early this week after enjoying a $1,000 price boost from the news that the G20 would not be receiving any further regulatory recommendations from the FSB.


Author JOHN MCMAHON • MAR 20, 2018 • 04:03


Posted by David Ogden Entrepreneur
David Ogden Entrepreneur


Alan Zibluk – Markethive Founding Member

Bitcoin Price Surges 10% as G20 Will Not Crackdown on Cryptocurrencies

Bitcoin Price Surges 10% as G20 Will Not Crackdown on Cryptocurrencies

Bitcoin Price Surges 10% as G20 Will Not Crackdown on Cryptocurrencies

The G20’s announcement that it will pivot away from creating new regulations in favor of examining existing rules gave the cryptocurrency market a much needed seeing Bitcoin surge by $1000.


No New Regulations

The anticipation of what new regulations might come of the G20 meeting this week in Buenos Aires added to a rocky cryptocurrency market over the past week but the news as reported by Reuters is that there will be no new regulation recommendations handed down.

Some of the nervousness of cryptocurrency market watchers coming up to the G20 was due in part to the fact that Mark Carney, Governor of the Bank Of England and outspoken critic of Bitcoin heads the Financial Stability Board which coordinates financial regulation for the Group of 20 economies.

Carney has been very vocal about his doubts concerning the credibility of cryptocurrency in the past speaking as the head of the Bank of England.

Deciding that there was not enough of a consensus to create radical new regulation among the 20 countries that make up the G20 the FSB issued a letter to the central bankers and finance ministers who will convene in Buenos Aries on the 19 and 20 saying

“The FSB’s initial assessment is that crypto-assets do not pose risks to global financial stability at this time,”

Carneys singing off on this letter shows an increased willingness in his attitude towards accepting cryptocurrency as part of the worlds financial system. Noting that this would be his last year as both chairman of the FSB and Governor of the Bank of England he said his successor would be reviewing existing rules as opposed to pushing through new standards.
 

Scaling Down

President Donald Trump set a mood for scaling back regulatory powers when he ordered American regulators to relax post-banking crisis reforms in order to encourage lending in the economy.

This made world regulators speculate that America, already reticent to join global regulatory bodies would reject any new suggestions and possibly fragment markets.

In reaction, the FSB membership vowed to make a complete review of whether the watchdog is still “fit for Purpose” for evaluating and amending rules.

Having already scrapped a quarter of its working groups in an effort to make the FSB more efficient and dedicated Carney said “As its work to fix the fault lines that caused the financial crisis draws to a close, the FSB is increasingly pivoting away from design of new policy initiatives towards dynamic implementation and rigorous evaluation of the effects of the agreed G20 reforms,”

This seemingly good news for cryptocurrency regulation and the hangover effects of the latest Mt. Gox bulk sale wearing off gave the faltering Bitcoin price a nice boost, up $1000 recovering nearly 8% of its value in 24 hours.
 

Author JOHN MCMAHON • MAR 19, 2018 • 05:03


Posted by David Ogden Entrepreneur
David Ogden Entrepreneur

Alan Zibluk – Markethive Founding Member

Bitcoin Cash Price Weekly Analysis – BCH/USD Remains at Risk

Bitcoin Cash Price Weekly Analysis – BCH/USD Remains at Risk

Key Points

  • Bitcoin cash price struggled to recover and moved below the $950 level against the US Dollar.

  • There is a crucial bearish trend line forming with resistance at $975 on the 4-hours chart of the BCH/USD pair (data feed from SimpleFX).

  • The pair remains at a risk of more declines and it could even break the last low of $867 in the near term.

Bitcoin cash price is under pressure below $975 against the US Dollar. BCH/USD may continue to decline towards $850 and $800 support levels.

Bitcoin Cash Price Downtrend

This past week pushed bitcoin cash price in a bearish zone below $1,000 the US Dollar. There was a sharp downside move and the price settled below the $1,000 level and the 100 simple moving average (4-hours). There was a decline towards the $850 level and a low formed at $867. A recovery was initiated and the price moved above the 23.6% Fib retracement level of the last decline from the $1,160 high to $867 low.

However, the upside wave was protected by the $1,050 level. Moreover, the 61.8% Fib retracement level of the last decline from the $1,160 high to $867 low acted as a hurdle. At the moment, the price is trading lower and is well below the $950 level. On the upside, there is a crucial bearish trend line forming with resistance at $975 on the 4-hours chart of the BCH/USD pair. It seems like the pair may continue to decline and it could even break the $900 level in the near term.

Further below $900, the last low of $867 could be tested. Moreover, there is a risk of a test of $850, which is a major support zone.

Looking at the technical indicators:

4-hours MACD – The MACD for BCH/USD is once again moving in the bearish zone.

4-hours RSI (Relative Strength Index) – The RSI for BTC/USD is now well below the 50 level.

Major Support Level – $850

Major Resistance Level – $975


Author: AAYUSH JINDAL   MAR 18, 2018  04:03


Postwd By David Ogden Entrepreneur
 

Alan Zibluk – Markethive Founding Member

Look Mom I have a Blog