Bitcoin BTC Daily Price Forecast November 14

Bitcoin (BTC) Daily Price Forecast – November 14

Bitcoin (BTC) Daily Price Forecast – November 14

  • BTC/USD Medium-term Trend: Ranging
  • Resistance Levels: $6,800, $6,900, $7,000
  • Support levels: $6,300, $6,100, $5,900

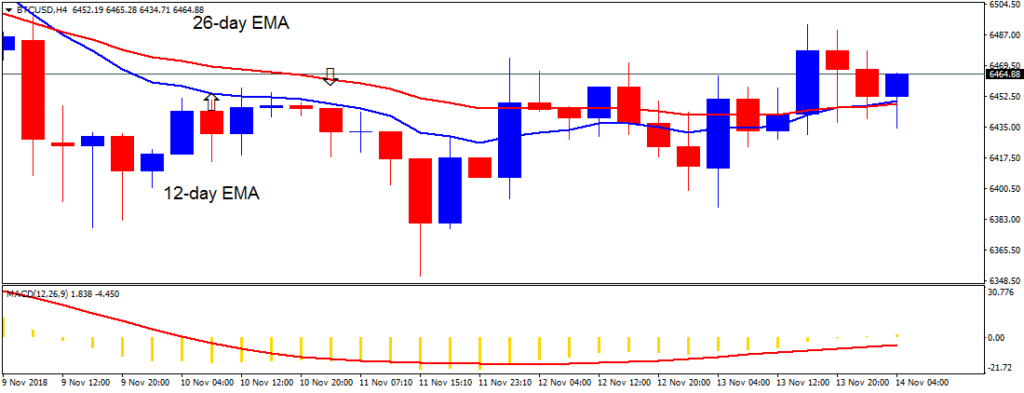
Yesterday, November 13, the price of Bitcoin was in a sideways trend. The crypto’s price had been in a sideways trend before price broke that level to the low of $6,300 on November 11. On November 13, the crypto’s price has resumed its sideways trend. Price of Bitcoin is now fluctuating above the $6,400 price level.

The 12-day EMA and the 26-day EMA are horizontally flat indicating the sideways trend. The small body’s candlesticks are indecisive candlesticks describing the indecision of buyers and sellers at the $6,400 price level. There will be no trade recommendation as the price of Bitcoin is still in a sideways trend. Meanwhile, the crypto’s price is above the 12-day EMA and the 26-day EMA indicating that price is likely to rise. The MACD line and the signal line are above the zero line which indicates a buy signal.
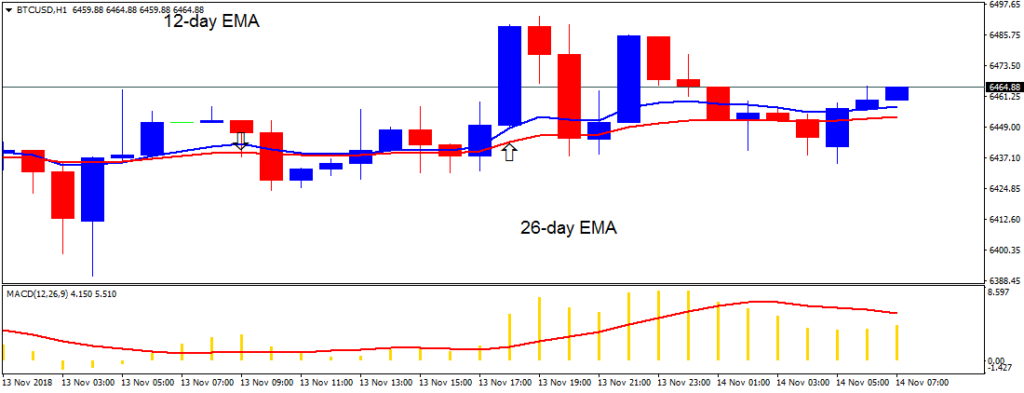
On the 1-hour chart, the price of Bitcoin is in a sideways trend. The price bars are fluctuating above the exponential moving averages. The MACD line and the signal line are above the zero line which indicates a buy signal.
 

By Azeez M – November 14, 2018

Alan Zibluk Markethive Founding Member

Bitcoin BTC Daily Price Forecast November 12

Bitcoin (BTC) Daily Price Forecast – November 12

Bitcoin (BTC) Daily Price Forecast – November 12

BTC/USD Medium-term Trend: Bearish

Resistance Levels: $6,800, $6,900, $7,000

Support levels: $6,300, $6,100, $8,900

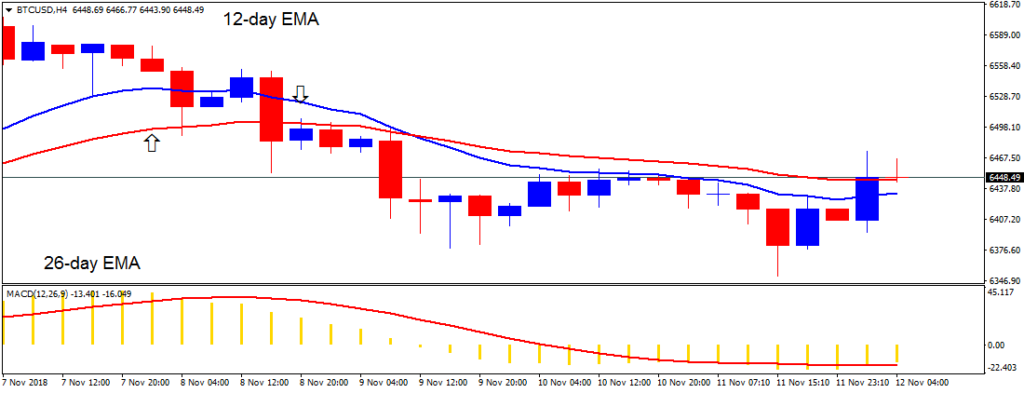
Last week the price of Bitcoin was in a bullish trend. The digital currency reached a high of $6,606.42 but the bulls failed to take price to the $7,400 price level. On November 7, the crypto faced resistance at $6,600 price level and it fell. It was suggested that if price broke the $6,400 price level in a downward trend, the crypto would find support at the $6,200 price level.
 

Today, the crypto fell and approached the $6,300 price level but now in a bullish trend. Price of Bitcoin is likely to continue its rise. Meanwhile, the digital currency is below the 12-day EMA and the 26-day EMA indicating that price is in the bearish trend zone. The MACD line and the signal line are below the zero line which indicates a sell signal.

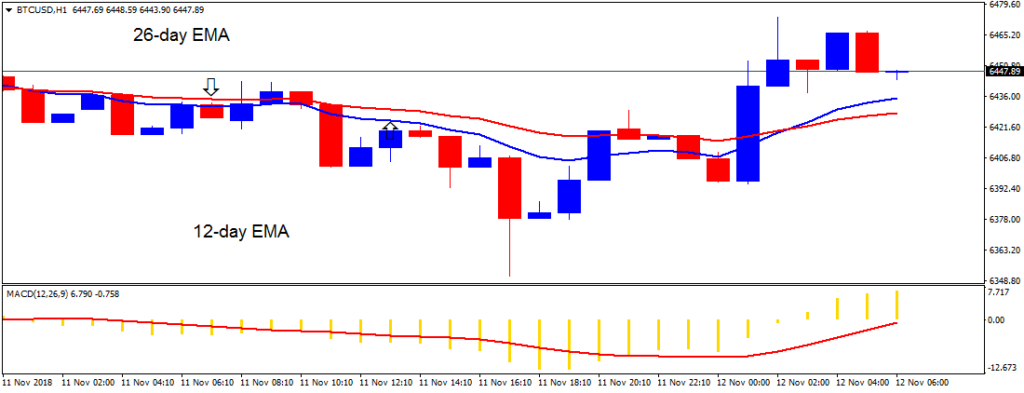
On the 1-hour chart, the digital currency reached a low of $6,350 and pulled back. The crypto's price is above the 12-day EMA and the 26-day EMA indicating that price is in the bearish trend zone. The MACD line and the signal line are below the zero line which indicates a sell signal.

The views and opinions expressed here do not reflect that of BitcoinExchangeGuide.com and do not constitute financial advice. Always do your own research.

By Azeez M – November 12, 2018

Alan Zibluk Markethive Founding Member
Look Mom I have a Blog