Bitcoin Price Analysis – BTC Acquires “Safe Haven” Status After Brexit Woes
All in all, Bitcoin prices are on an uptrend. Backing these are boosting fundamentals with investors anchoring their bullish hopes on Bakkt, the ICE subsidiary. The platform will make use of Microsoft technologies for expediency. Regardless, our previous trade plan holds true. Even with a modest three percent gain in the last week, we need to see strong gains above $7,000 or safely $7,200 for trend continuation. Thereafter we shall recommend large volume buys with targets at $10,000.
Latest Bitcoin News
At current levels, Bitcoin prices are not only vibrant but are bottoming up. Bitcoin prices are up roughly $500 from last week’s lows. Factoring in candlestick formations, it appears that there is more room for upsides thanks to spikes in market participation levels.
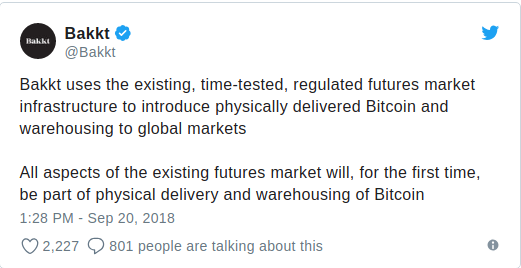
All eyes are now set on Intercontinental Exchange (ICE), the owners of the New York Stock Exchange. The ICE plans on launching a new regulated “on-ramp” platform for institutional investors, merchants and retail investors to trade, store and spend various digital assets through
All aspects of the existing futures market will, for the first time, be part of physical delivery and warehousing of Bitcoin
Bakkt will utilize MS cloud solutions with backing from traditional Wall Street companies and crypto funds as Starbucks, BCG and Fortress Investments. Once they get the green-lights, Bitcoin prices will likely on a high by the end of the year as investors rush to invest. In fact the optimism is so high that Michael Novogratz, the Former Managing Partner at Goldman Sachs said it is impossible for Bitcoin prices not to test $10,000 by the end of the year re-affirming his previous stands on price.
Bitcoin Technical Analysis
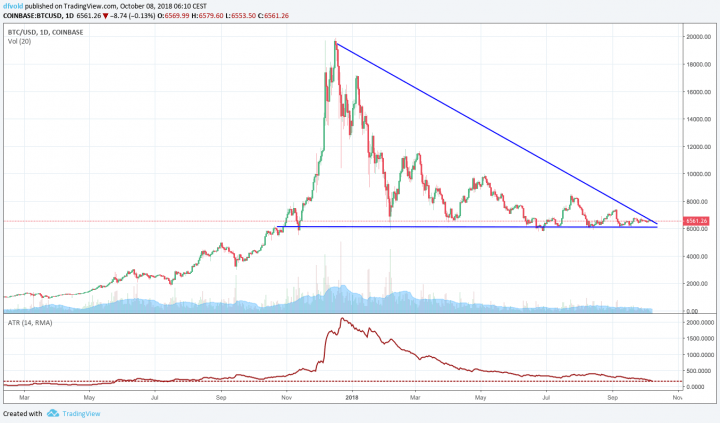
Weekly Chart
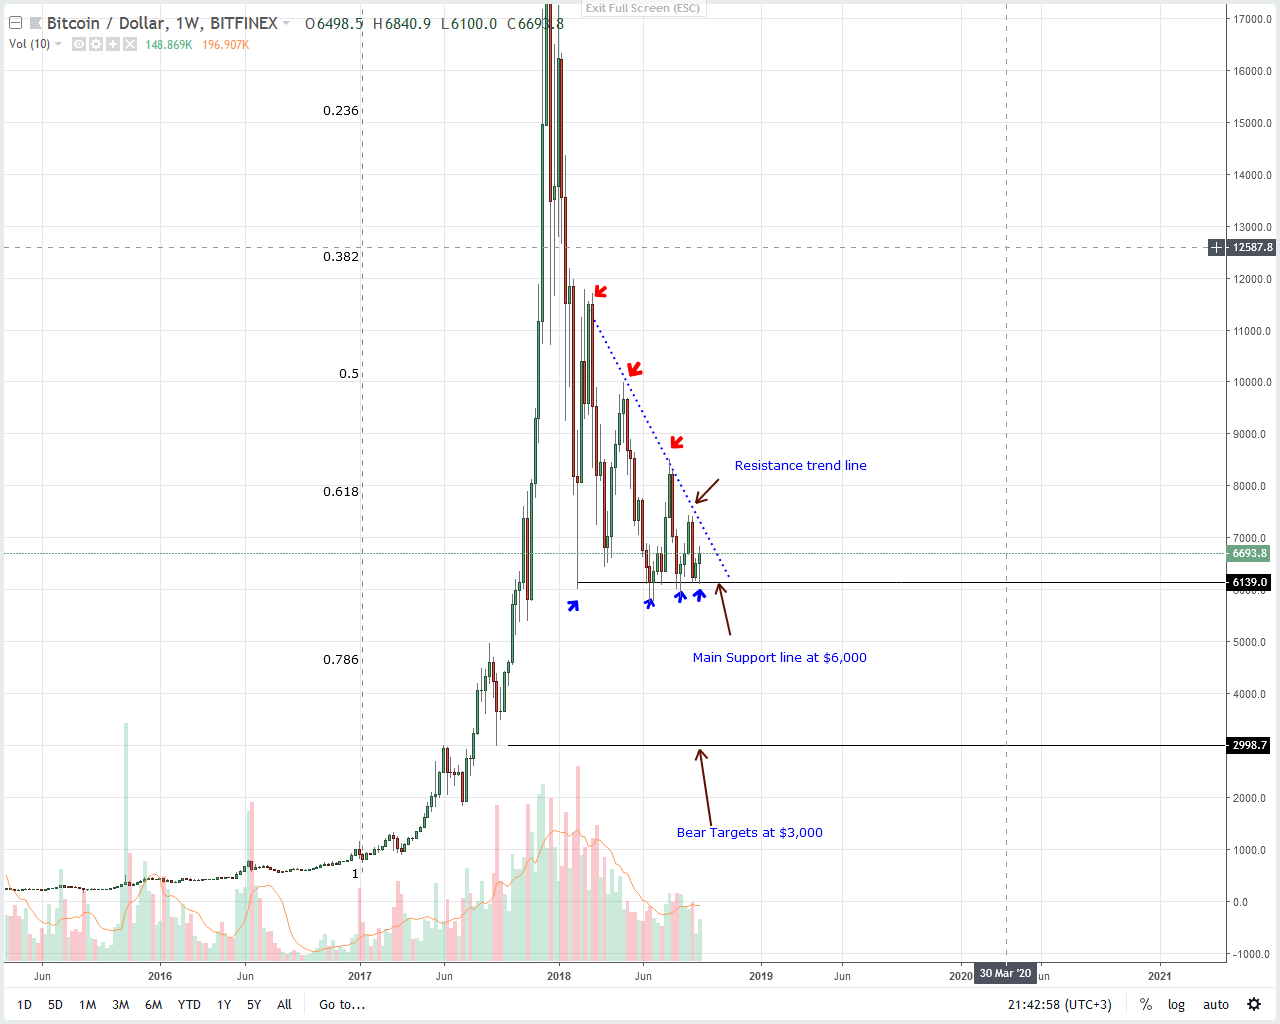
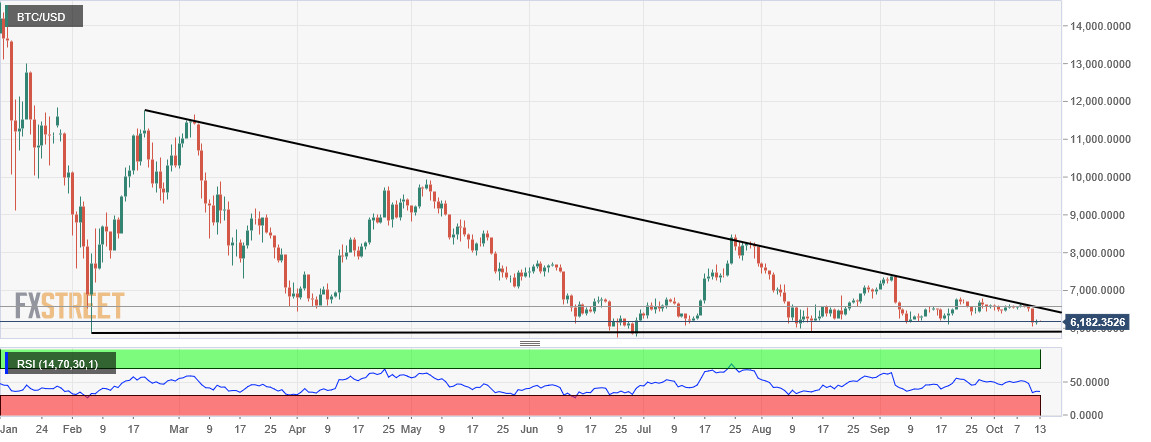
Though there is optimism in the market, our last Bitcoin trade plan is solid and on course. From the weekly chart, it’s clear that Bitcoin prices are on a consolidation. As they oscillate within a $1,200 range with supports at $5,800–$6,000 support and $6,800–$7,200 resistance level, our Bitcoin buy triggers would only go live once there are conclusive surges above the resistance trend line separating buyers and sellers at around $7,200—Sep 2018 highs. Besides the ranging market, the $6,000 level is proving to be a solid foundation for Bitcoin buyers.
After all, BTC sellers have so far retested $6,000, six times. Every time sellers fail to breach these resilient floors. Overly, this is good for BTC optimists. It goes to show how important $5,800–$6,000 level is from our analysis.
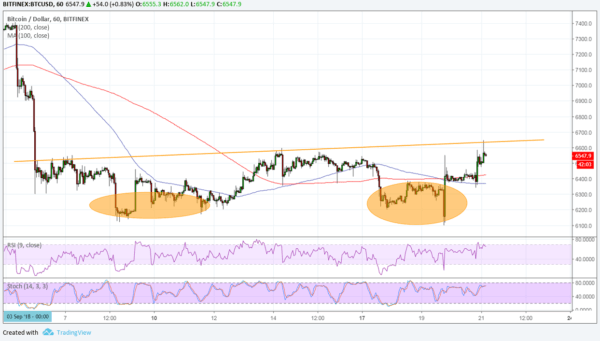
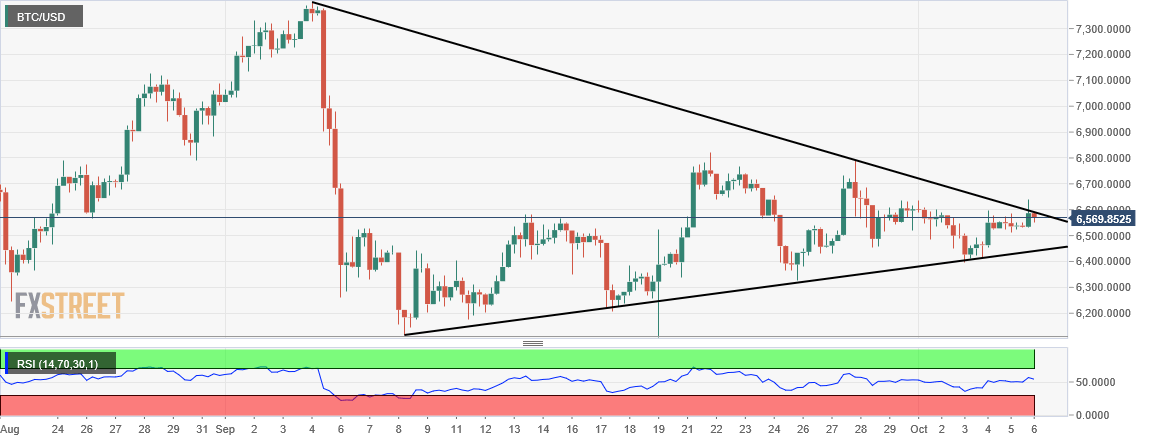
Daily Chart
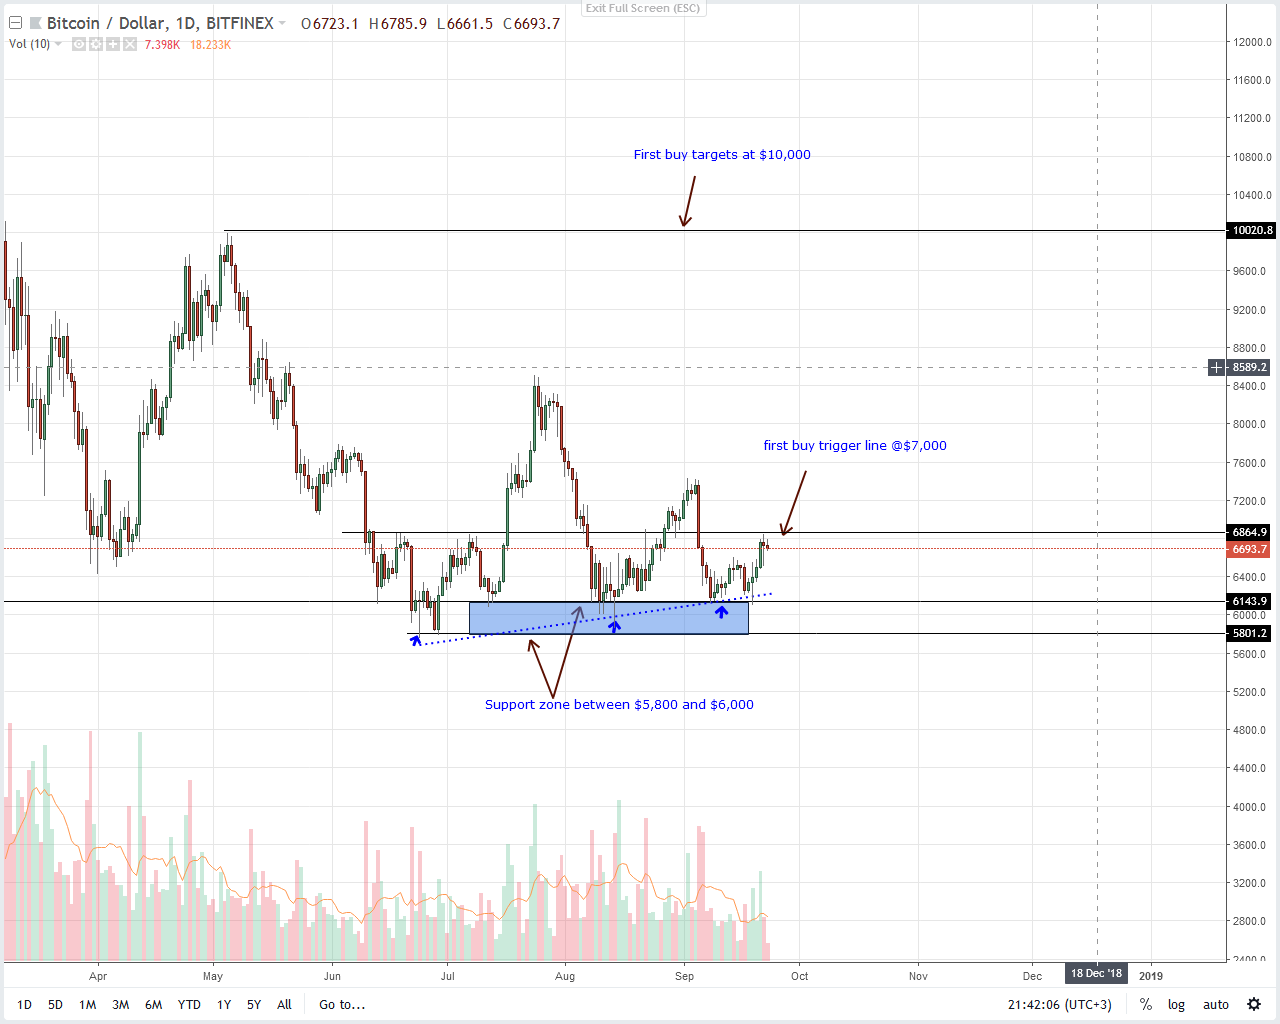
Before Sep 18 surges, $6,500 or Sep 17 highs were our minor resistance level. Cementing our decision to anchor suitable stops and buy triggers at $6,500 was those high trading volumes of Sep 17.
Notice that average volumes before Sep 17 bearish engulfing candlesticks were low. Besides, we would strong reasons to hold on to short positions because Sep 18-20 candlestick volumes were low. However, after Sep 21 price explosion at the back of high volumes, sells were nullified and short term bulls were triggered with first targets at Sep 5 highs at $7,300.
In the course of this week, it’s likely that Bitcoin bulls will follow through. In that case conservative buyers would only enter long trades if and only if there is Sep 21-like breach above $7,000–$7,200. Thereafter, we can recommend loading on pull backs in lower time frames with first targets at $8,500 and later $10,000.
DALMAS NGETICH | SEPTEMBER 24, 2018 | 4:30 AM
Alan Zibluk Markethive Founding Member

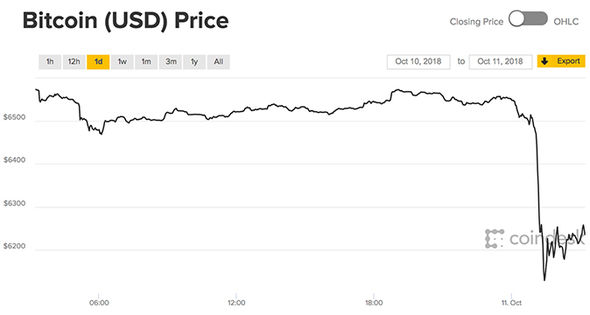


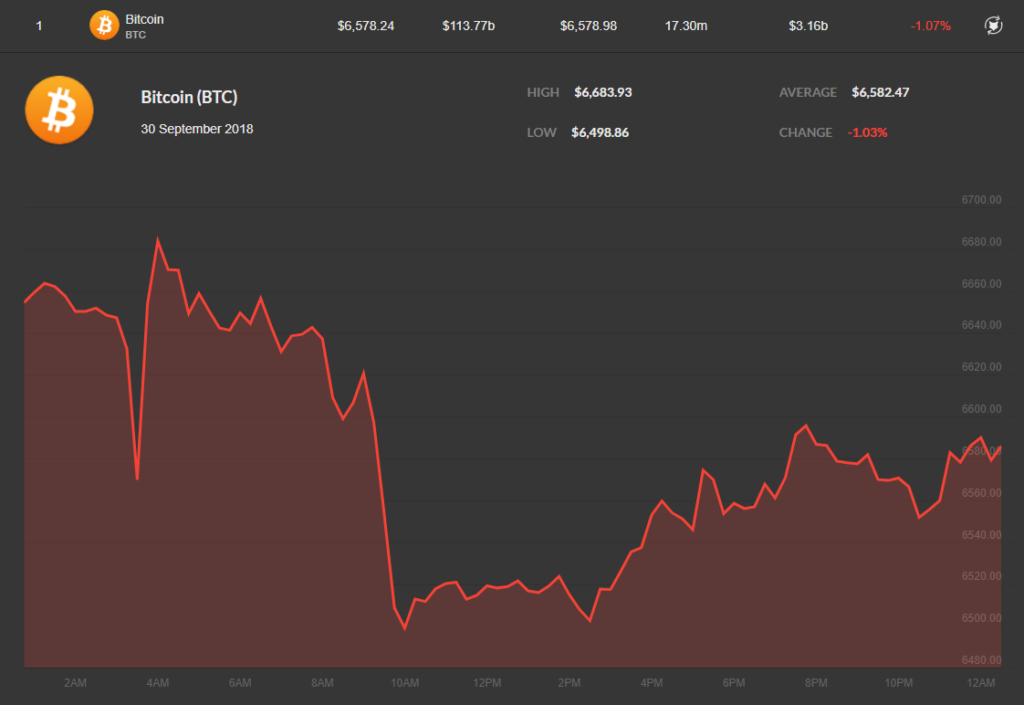 Bitcoin daily price chart on September 30, provided by Coincap.io