Tag Archives: bitcoin news

Bitcoin price analysis: BTCUSD stays marginally above 5300 RSI implies that the recovery may be limited

Bitcoin price analysis: BTC/USD stays marginally above $5,300, RSI implies that the recovery may be limited

Bitcoin price analysis: BTC/USD stays marginally above $5,300, RSI implies that the recovery may be limited

  • BTC/USD bulls try to hold the ground above critical support.

  • The critical resistance lies with $5,500.

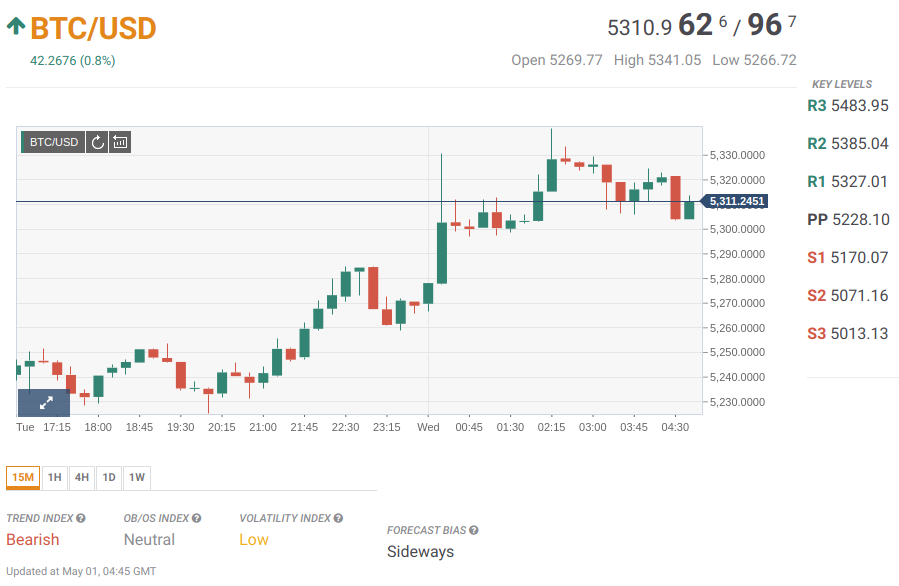
BTC/USD is changing hands at $5.330, nearly 3% higher from this time on Tuesday. The first digital coin managed to break above several strong resistance levels and return the range of the previous week. While the coin is nearly 4% lower on a week-on-week basis, a sustainable move above $5,300 has improved the technical picture and mitigated an immediate bearish pressure.

Bitcoin’s short-term technical picture

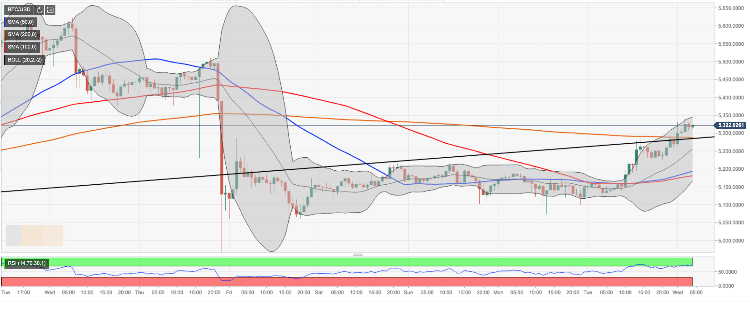
On the intraday charts, BTC/USD has settled above the previously broken channel support and SMA200 (1-hour) clustered under $5,300 handle. While the further upside is capped by $5,344 (the upper boundary of 1-hour Bollinger Band, the short-term trend remains bullish as long as $5,250 remains intact.

On the upside, t we will need to see BTC above $5,500 to say that the downside correction is over that the coin is ready to resume the upside movement. However, the Relative Strength Index on intraday charts has started to reverse from an overbought territory, which means that the coin may extend the downside towards the above-said support of $5,250 before the growth is resumed.

BTC/USD, 1-hour chart


Tanya Abrosimova

FXStreet


Alan Zibluk Markethive Founding Member

Bitcoin price analysis – Say hello to 5000 as BTCUSD settles below 5200 handle

Bitcoin price analysis - Say “hello” to $5,000 as BTC/USD settles below $5,200 handle

  • BTC/USD is sidelined in a new range under $5,200.

  • The intraday RSI implies a short-term recovery.

Bitcoin is changing hands at $5,177 at the time of writing, mostly unchanged since this time on Sunday. The largest digital asset has been consolidating losses since a sudden collapse on April 25 potentially caused by Tether-Bitfinex allegations.

Bitcoin’s technical picture

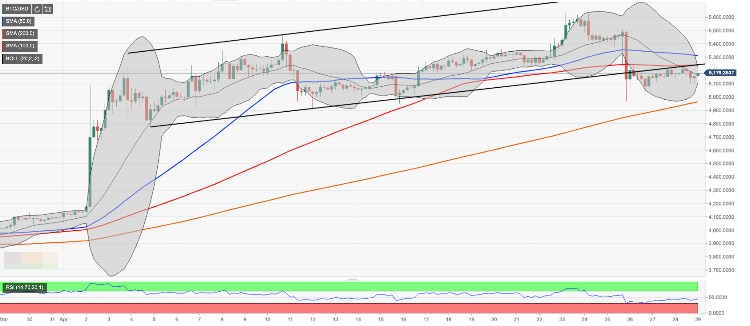
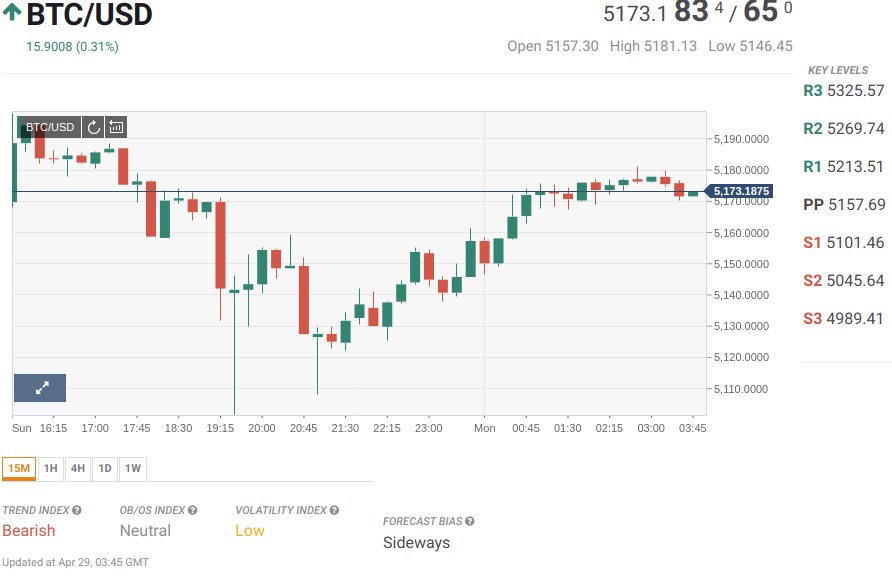
Looking technically, BTC/USD managed to recover from the recent low of $4,968. An upward-looking intraday SMA implies that the coin may continue moving higher, however, the further upside is limited by the broken channel support currently at $5,245. This barrier serves as a strong initial resistance that needs to be taken out before we can proceed to the next bullish aim at $5,300 closely followed by SMA50 (4-hour) at 5,311.

On the downside, the initial support is seen at $5,100. This area, strengthened by the lower boundary of 4-hour back inside the range. Once it is cleared, the sell-off may be extended towards psychological $5,000 and SMA200 (4-hour) currently at $4,964.

BTC/USD, 4-hour chart


Tanya Abrosimova

FXStreet

Alan Zibluk Markethive Founding Member
Bitfinex Alleged Missing 850 Million Puts Pressure on Crypto Markets

Bitfinex Alleged Missing $850 Million Puts Pressure on Crypto Markets


Bitfinex Alleged Missing $850 Million Puts Pressure on Crypto Markets

Bitcoin took an unexpected dive on markets overnight with pundits pointing at the New York State Attorney General’s investigations into a Bitfinex cover-up of missing Tether.

Major exchange Bitfinex allegedly attempted to cover missing funds totaling USD 850 million by raiding its Tether reserves in order to pay out customers. Between May 2015 and August 2016, Bitfinex was reportedly attacked by hackers who stole BTC 1,500 in 2015 and USD 72 million worth of Bitcoin in 2016.

The dent in the Tether cap was no mean figure according to stablecoins producer Paxos, suggesting that the dip into the funds would account for at least 27% in Tether’s dollar reserves. The news was not lost on the market causing a significant dip which is still trying to recover with Bitcoin dropping 6% at one stage.

The lawsuit refers back to previous messages from Bitfinex which indicates that all was not well as far back as August of 2018. The following message from a Panamanian payment processor to which it had transferred funds indicates the degree to which the exchange has found itself in deep water:

“THE SITUATION LOOKS BAD. WE HAVE MORE THAN 500 WITHDRAWALS PENDING AND THEY KEEP COMING IN … [T]OO MUCH MONEY IS PARKED WITH YOU AND WE ARE CURRENTLY WALKING ON A VERY THIN CRUST OF ICE.”

Further, the attorney general suggested that Bitfinex uses a network of money agents including “human being friends of Bitfinex employees that were willing to use their bank accounts to transfer money to Bitfinex clients”.

The actual investigation into Bitfinex has been ongoing over a period of months in its attempts to uncover if Bitfinex and Tether have impacted customers through fraudulent activity; an operation which involves the FBI and other US federal agencies.


By Harold Vandelay Posted on 27/04/2019

Alan Zibluk Markethive Founding Member
Bitcoin Price Analysis Are We Heading for a Breakout or a Fadeout?

Bitcoin Price Analysis – Are We Heading for a Breakout or a Fadeout?

Bitcoin Price Analysis – Are We Heading for a Breakout or a Fadeout?

I want to have a closer look at bitcoin technical analysis and the levels that are important to keep an eye on over the next few weeks.

Bitcoin is up 45% since I posted an article back in February about how I think the tide is turning.

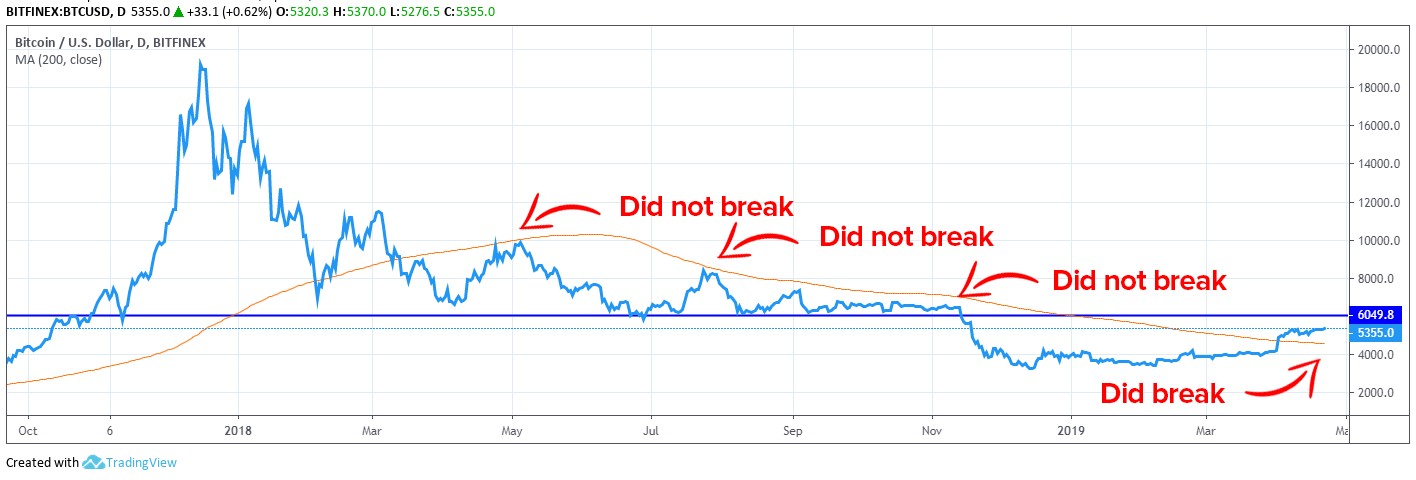
Prices have been mirroring the 200-day moving average shown in red in the chart above. Previously, we can see that bitcoin got close to the 200-day moving average, but failed to break through and then fading back down.

As we can see now bitcoin has now rallied past the 200-day moving average for the first time in a long time.

Bitcoin now has resistance at the $5300 level, where it has roughly been since the earlier this month, but rather than fading as it did in the past, it is holding in a tight range.

This shows the action is bullish and is likely going to have its next move be another push higher. The next resistance level is up just north of $6000.

So, is this a sign of a breakout coming or will bitcoin once again fail to climb the ladder?

As long as bitcoin holds above the line (currently about $5,100), then the odds are in favor a shaper move higher over the coming weeks.

The chances of bitcoin making a break higher up to the $6000+ level is significant, but for those who want to protect themselves, putting in a stop order at $5000 will allow them to capitalize on the probable upward move while applying protection in case the position breaks down.

To see how I have been able to uncover bitcoin prices swings correctly over the last several years join my next presentation where I outline my favorite cryptocurrency trading strategy and what I look for to give myself the best opportunity to profit. Click here to learn more.


Disclaimer: This is not trading or investment advice. The above article is for entertainment and education purposes only. Please do your own research before purchasing or investing into any cryptocurrency.


By cdouthit – April 26, 2019

Alan Zibluk Markethive Founding Member

Bitfury and Swiss Investors Launch Bitcoin Mining Fund

Bitfury and Swiss Investors Launch Bitcoin Mining Fund

Bitfury and Swiss Investors Launch Bitcoin Mining Fund

Bitcoin mining technology firm Bitfury Group, recently valued at USD 1 billion, has entered an alliance with Switzerland-based investment firm Final Frontier to launch a regulated Bitcoin mining fund, as reported by Reuters.

Under the supervision of Liechtenstein’s financial regulator, the Financial Market Authority, the fund was developed for both institutional and professional investors to claim access to “the esoteric world of bitcoin mining”.

Bitcoin mining is basically the means by which the Bitcoin network is secured and transactions validated, using computing power to solve extremely difficult cryptographic puzzles. A computer, or a collection of computers connected to a node, credited with solving the next puzzle will have built a block. New blocks will include verified transactions and are added to a chain of chronological blocks, hence adding on to a blockchain. The node credited with finding a new block also receives a block reward of freshly minted bitcoin, so this is also a way of minting new coins, hence, Bitcoin mining.

It has proven to be a profitable business for almost a decade now, with home mining on personal computers very quickly switching to more powerful processors, and eventually companies like Bitfury manufacturing highly specialized equipment called ASICs. Bitfury’s part in this new deal will be to supply the hardware and end-to-end services for the Bitcoin mining fund. It will also be responsible for scouting out the new sites for the activities, deploying equipment and servicing them later.

Ultimately, the fund hopes to invest in mining sites operating with the lowest costs featuring Bitfury data centers. Final Frontier co-founder Imraan Moola aid:

“WITH THE BITCOIN PRICE DOWN SIGNIFICANTLY FROM ITS ALL-TIME HIGH, YET INSTITUTIONAL INTEREST GROWING EVERY DAY, NOW MAY BE AN OPPORTUNE TIME TO CONSIDER INVESTING IN BITCOIN MINING.”


By Saloma Posted on 24/04/2019 3 min read

Alan Zibluk Markethive Founding Member
Technicals Trends Say Bitcoin BTC Bottom Is In Prominent Analysts Agree

Technicals Trends Say Bitcoin (BTC) Bottom Is In, Prominent Analysts Agree

Technicals Trends Say Bitcoin (BTC) Bottom Is In, Prominent Analysts Agree

RSI Reading Hints Bitcoin Bottom Is In


I’m sure you’ve heard the popular adage: “great minds think alike.” While this seems true in scientific contexts, in the case of finance, even cryptocurrencies, this is far from the case. If you don’t get what I’m referring to: the question “has Bitcoin (BTC) bottomed?” has pained crypto investors since BTC plummeted to $3,150 in the middle of December.

While some, especially those subscribed to the Hyperwave theory, claim that cryptocurrencies are poised to head lower, leading analysts across the board to claim that bears have bitten the dust at last.

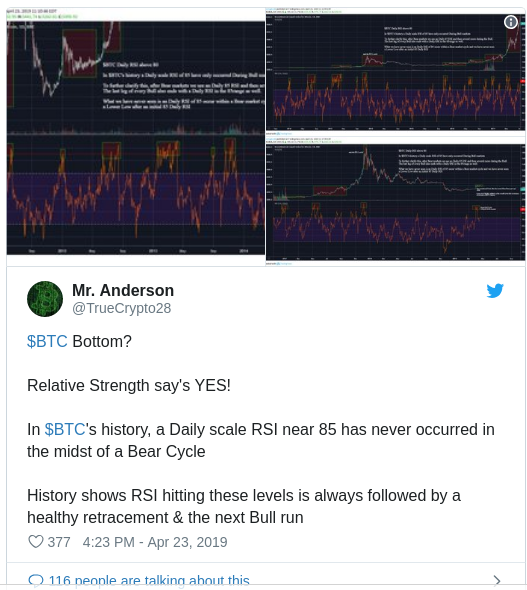
In a recent Twitter post, a trader going by “Mr. Anderson” claimed that if history is followed, Bitcoin established a long-term bottom in the low $3,000s. He remarked that throughout Bitcoin’s entire history as a liquid, tradable asset, BTC’s daily chart has only seen a Relative Strength Index (RSI) reading of above/near 85 in bull cycles.

Anderson adds that history shows that RSI hitting 85 and beyond is “always followed by a healthy retracement and next bull run.” This, for those unaware, means that while Bitcoin could soon see a temporary pullback, the bear trend is over more likely than not.

Tom Lee recently made a similar remark. The Fundstrat head of research/co-founder recently remarked that his firm’s Bitcoin Misery Index has only posted readings of above 67 (happy/bullish) in bull markets. And guess what? The proprietary indicator printed an 89 on the day after BTC rallied past $5,000 for the first time since November. As he explained:

Since 2011, BMI > 67 only seen during BTC bull markets. It means that a bull market is likely starting.

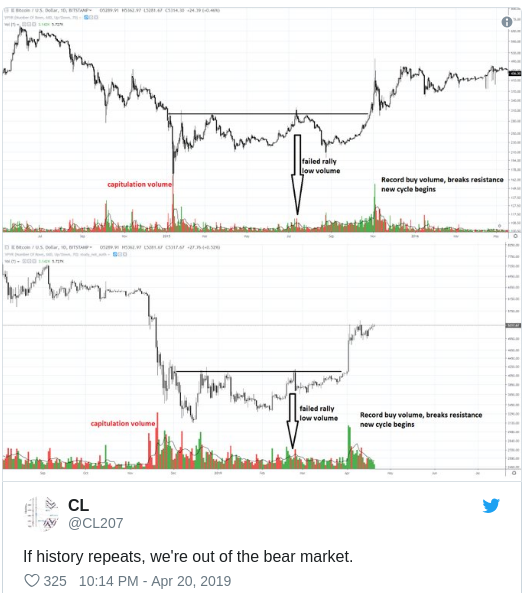
Simple chart structure also suggests that the downturn is finally over. Trader CL recently accentuated, Bitcoin’s one-day chart from August to now looks eerily like that of the bottom of the 2014 to 2016 market cycle. In fact, three specific events in these two cycles are effectively identical from a technical standpoint. Firstly, the capitulation event saw a monumental red volume candle. Secondly, a failed bear market rally occurred on little volumes. And lastly, the breakout past resistance was met with record buying volume. As CL writes: “if history repeats, we’re out of the bear market.”

Fundamentals, too, are showing that BTC is likely soon to rally. Willy Woo recently remarked that the Balanced Price indicator from Adaptive Capital’s David Puell looks as it did when the 2015 – 2016 bear market came to a close. NVT Signal’s recent action resembles that seen in early-2015, which came after BTC established a long-term floor. Woo’s very own Cumulative Value Days Destroyed indicator, which has historically caught bottoms to near a tee, showed that Bitcoin recently broke out of an upper accumulation band following a strong, convincing bounce off the lower band. And three key iterations of NVT have begun to converge, looking much like they did at 2015’s bottom.


By Nick Chong April 24, 2019

Alan Zibluk Markethive Founding Member
Bitcoin price analysis – BTCUSD defies bearish sentiments amid record volatility growth

Bitcoin price analysis - BTC/USD defies bearish sentiments amid record volatility growth

Bitcoin price analysis – BTC/USD defies bearish sentiments amid record volatility growth

  1. Bitcoin’s volatility grew by 200%.

  2. The upside trend is gaining traction with the next focus on $5,560.

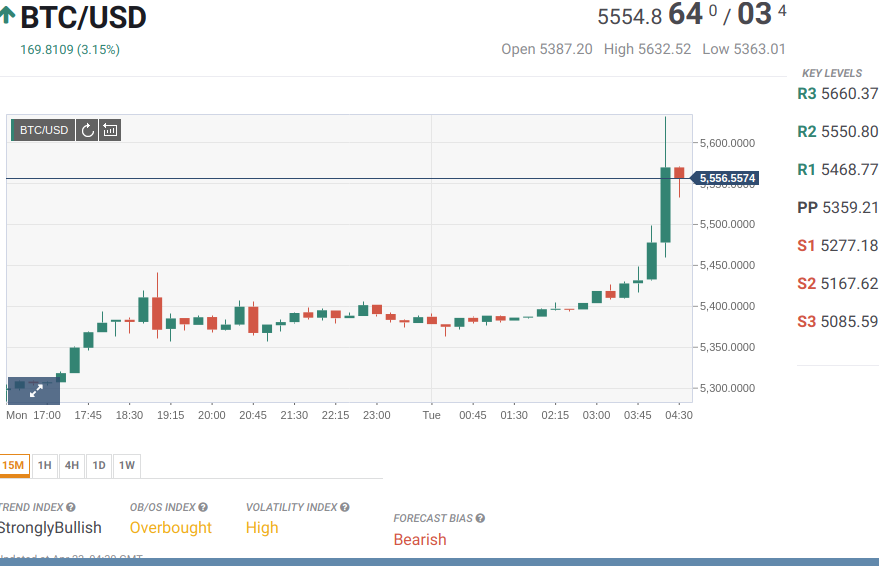
Bitcoin, the largest and the most popular cryptocurrency out there, is changing hands at $5,400. BTC/USD bottomed out at $5,214 on April 21 and has been moving upwards ever since. The coin touched $5,441 high during late Monday session, but failed to hold the ground above $5,400.

The Bitcoin volatility jumped nearly 200% in the recent month. Thus, following the price growth in the beginning of April, the volatility jumped from 1.26% to 3/31% in just two days. Since that time, the Bitcoin has been trading in a narrow range limited by $4 900 and $5 400 boundaries. At the time of writing, the daily volatility of the first digital asset reached 3.54%, which is the highest level in recent three months.

It is worth mentioning, that the Bitcoin’s volatility has been sliding slowly during several years. It is reduced by 98% in 2018.

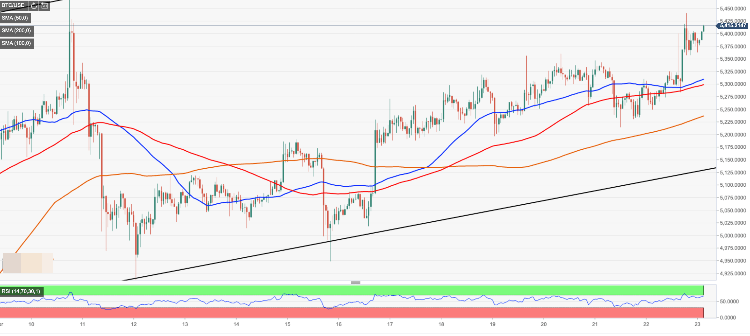
On the intraday charts, BTC/USD is moving within an upside trend. The Relative Strength Index points to the North, which is consistent with the bulls’ case scenario. A sustainable move above the recent high will take us towards $5,500 handle and to $5,560, which is the highest level since November, 19, 2018.

On the downside, the initial support is created by the intraday low $5,363. Once below, the sell-off may continue towards $5,300 supported by SMA50 and SMA100 (1-hour). The next barrier is created by SMA200 at $5,235 and the lower boundary of the recent upside channel at $5,140.

BTC/USD, 1-hour chart

Tanya Abrosimova

FXStreet

Alan Zibluk Markethive Founding Member

Bitcoin price long term analysis April 2019

 Bitcoin price long term analysis April 2019

Bitcoin price long term analysis April 2019

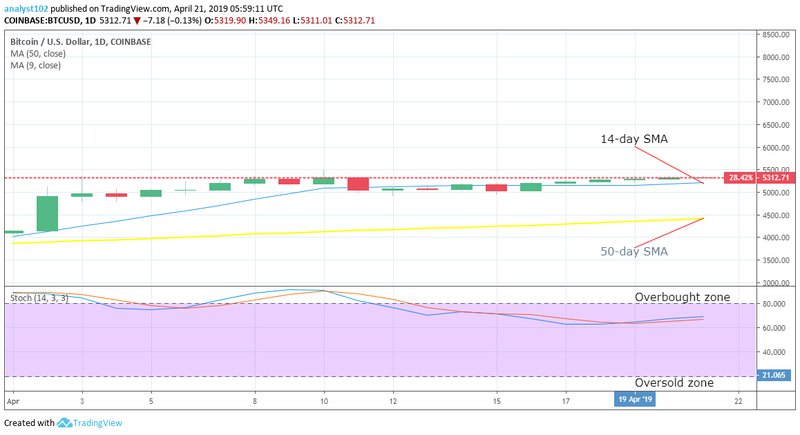
The Bitcoin price analysis has revealed that no remarkable rise in the price is noted in the long term trend. The value of the US dollar does not show any increase and are constant in their value. The cryptocurrency price value was spotted between five thousand five hundred dollars and five thousand dollars ($5,500 and $5000) marks. It is further not fluctuating much on the trend-line as analyzed by the trading view. The trending range was: Accumulation territories: $3000, $3,500 and $2,500 Distribution territories: $6, 000, $6,500 and $7000 Critical Analysis: The crypto- market seems to be resilient over the past 14 days as seen on trading view chart, there would be no interesting fluctuations that can be witnessed on the trend-line and is making very slow moves. The SMA was reported to be closed on 5,500 upper range. The 50-day average was seen on the range of 4,500 trend-line. The estimated highest high over the past 14 periods as depicted by stochastic oscillator was expected to be around the range 60.

via Trading View

That shows that the market is in trending mote. The range five thousand and five hundred dollars ($5,500) is seen as the upper range which is said to be market rejection area which needs to attest the condition of a financial market of a group of securities in which prices are rising or expected to rise. It is noted that any large upward or downward movement of a price in a short period of time can cause serious consequences on the range zones.


By Shawn Du'Mmett APR 22, 2019

Alan Zibluk Markethive Founding Member

Bitcoin Displacing Gold Entirely Would Value BTC At 350000 – Is It Possible?

Bitcoin Displacing Gold Entirely Would Value BTC At $350,000: Is It Possible?Bitcoin Displacing Gold Entirely Would Value BTC At $350,000 –  Is It Possible?

Since its birth, Bitcoin (BTC) has been lauded as an alternative to traditional assets day in and day out. Most notably, the cryptocurrency is. in the eyes of some pundits, a replacement to gold, specifically the metal’s store of value capabilities. But if Bitcoin takes over gold’s hegemony, what would happen to the value of BTC?Related Reading: Bitcoin (BTC) Best Performing Major Asset in 2019, Surges 43% Year-to-DateThe Case For A Six-Figure BitcoinAccording to HodlWhale, a Seattle-based cryptocurrency investor, a world where Bitcoin has absorbed all the value of the gold in circulation would see BTC valued at $350,000.If #Bitcoin were to displace the value of gold the current value of a single Bitcoin would be $350K. Bitcoin has the ability to displace value across many financial and technology markets. $BTC is greater than #Gold #BTC350K— HodlWhale (@HodlWhale) April 19, 2019

This figure isn’t exactly baseless. As reported by NewsBTC on an earlier date, all gold in circulation is currently valued at approximately $7.83 trillion, while all BTC has a mere $94 billion valuation. If the latter was to fully displace the value of the first, Crypto Voices, an industry analytics and research group, estimated that BTC would swell to a value of $450,000 — slightly above HodlWhale’s estimate.And while this sounds absurd, especially considering that cryptocurrencies remain in the depths of a brutal bear market, some are sure that Bitcoin will become the “digital gold” that its investors want it to be.Could BTC Displace Gold? Mere days ago, Adamant Capital, a Bitcoin-centric fund led by long-time investor Tuur Demeester, released a report on the crypto market’s current status. Following an explanation that “whales” are accumulating cryptocurrencies en-masse, the market is expressing “hope,” and that a further drawdown could be possible if conditions are right, Adamant’s partners explained that they expect for Bitcoin to disrupt traditional assets, like stores of value and reserve assets.Our new report “Bitcoin in Heavy Accumulation” is out. Read here: https://t.co/DkjedcF3RG pic.twitter.com/UpQotZUTdW— Tuur Demeester (@TuurDemeester) April 18, 2019

The firm specifically looks to the growth of Bitcoin scaling, like the Lightning Network’s staggering growth and the rise of sidechains; the institutionalization/financialization of this industry through Bakkt, Nasdaq’s futures, etc., and the rise of the millennial demographic to claim that BTC could become a “globally used digital gold and reserve asset.” But why exactly should BTC usurp gold?Well, it’s simple, to be frank.As Gemini’s Tyler Winklevoss explained, Bitcoin is “better at being gold than gold itself” — a sentiment held by many long-standing cryptocurrency investors. He specifically looks to the fact that BTC is portable, sculpted for today’s digital society, even scarcer than the metal, censorship-resistant unlike traditional assets, and decentralized as a way to back this cheery sentiment. At one point, the cryptocurrency entrepreneur added that the only thing that gold has over BTC is a “3,000-year headstart.”Featured Image from Shutterstock


Published 40 mins ago on 20/04/2019 By NewsBTC.com


Alan Zibluk Markethive Founding Member
Bitcoin Price Watch – BTC Primed For Lift-off To 5500

Bitcoin Price Watch - BTC Primed For Lift-off To $5,500

Bitcoin Price Watch – BTC Primed For Lift-off To $5,500

  • Bitcoin price remained well supported above the $5,200 and $5,160 levels against the US Dollar.

  • The price is slowly grinding higher and it may well climb above the $5,350 level.

  • There is a major ascending channel in place with support at $5,210 on the hourly chart of the BTC/USD pair (data feed from Kraken).

  • The pair is trading nicely in an uptrend and it could continue to climb towards $5,400 and $5,500.

Bitcoin price remained well supported on the downside above $5,200 against the US Dollar. BTC is trading nicely in an uptrend and it seems like the bulls are aiming $5,400 or even $5,500.

Bitcoin Price Analysis

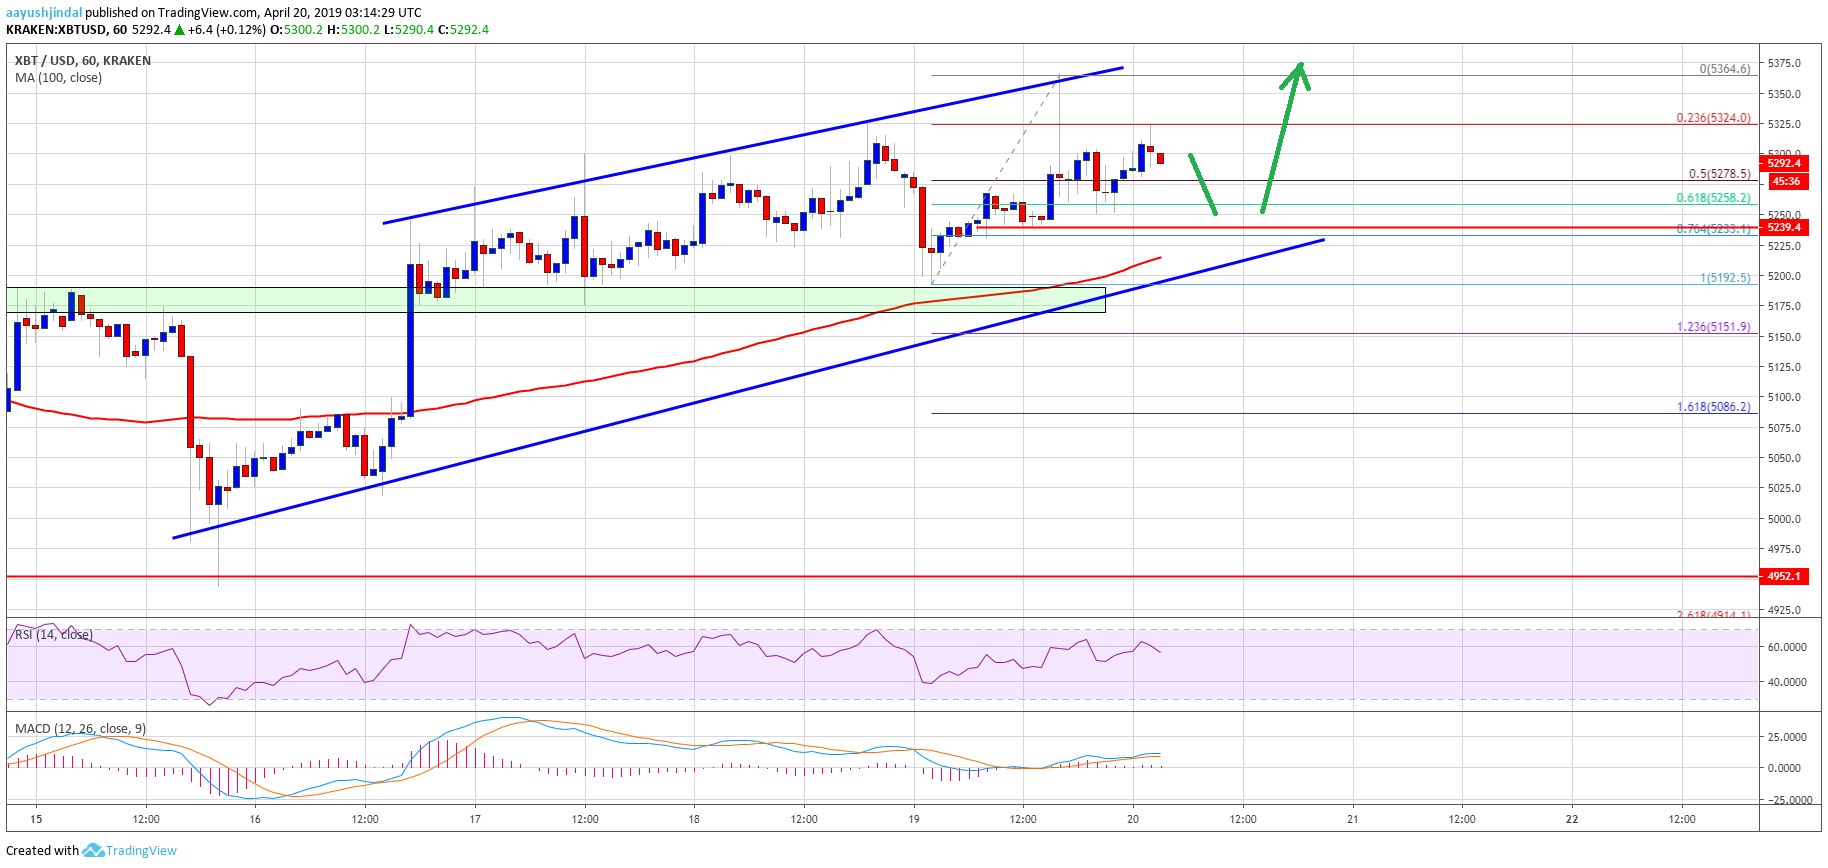
In the past three days, we saw a slow and steady rise above $5,100 in bitcoin price against the US Dollar. The BTC/USD pair broke the key $5,160 and $5,200 resistance levels to settle in a positive zone. There was even a close above the $5,200 level and the 100 hourly simple moving average. Intermediately, there were a few swing moves and downside corrections, but the price remained well bid above the $5,160 level. The last swing low was near at $5,192 before the price climbed above the $5,300 level.

The price traded as high as $5,364 recently and corrected lower. It broke the $5,280 level and the 50% Fib retracement level of the recent wave from the $5,192 low to $5,364 high. However, the decline was protected near the $5,250 support and the price remained well above the 100 hourly simple moving average. The 61.8% Fib retracement level of the recent wave from the $5,192 low to $5,364 high also acted as a strong support. More importantly, there is a major ascending channel in place with support at $5,210 on the hourly chart of the BTC/USD pair.

Therefore, dips towards the $5,220 and $5,200 levels remains well supported in the short term. On the upside, an initial resistance is near the $5,350 and $5,360 levels. A successful break above the $5,364 swing high is likely to open the doors for more gains above the $5,400 and $5,450 levels.

Looking at the chart, bitcoin price is clearly trading in a solid uptrend above the $5,200 support area. The bulls remain in action and there are chances of an upside break above the $5,400 resistance. On the downside, only a close below the green area at $5,160 could set the pace for more losses.

Technical indicators:

Hourly MACD – The MACD is currently placed nicely in the bullish zone.

Hourly RSI (Relative Strength Index) – The RSI for BTC/USD is currently correcting lower towards the 50 level.

Major Support Levels – $5,200 followed by $5,160.

Major Resistance Levels – $5,360, $5,400 and $5,500.


AAYUSH JINDAL | APRIL 20, 2019 | 4:08 AM

Alan Zibluk Markethive Founding Member