Tag Archives: Bitcoin Price Technical Analysis

Bitcoin Price Technical Analysis for 18th April – Look Out for this Reversal Pattern

Bitcoin Price Technical Analysis for 18th April – Look Out for this Reversal Pattern


Bitcoin Price Key Highlights

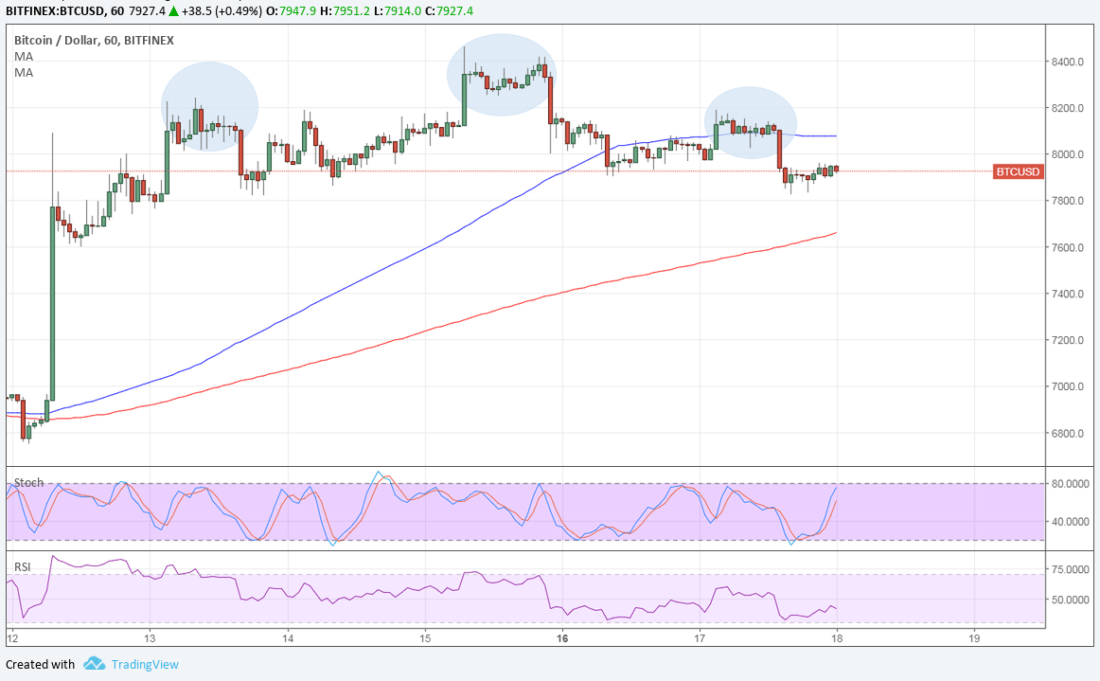
  • Bitcoin price is forming a head and shoulders on its 1-hour time frame to signal a potential selloff.
  • Price already seems to be breaking below the neckline to confirm that sellers have the upper hand.
  • Technical indicators are still suggesting that the uptrend could carry on, though.

Bitcoin price formed a short-term head and shoulders pattern, which is a classic selloff signal.

Technical Indicators Signals

The 100 SMA is still above the longer-term 200 SMA on the 1-hour time frame to indicate that the path of least resistance is to the upside. In other words, the uptrend is more likely to resume than to reverse.

Bitcoin price has broken below the 100 SMA dynamic support, though, so selling pressure could be picking up. Price could test support at the 200 SMA dynamic inflection point around $7600 next. The gap between the two is narrowing to signal weakening bullish momentum.

The head and shoulders pattern spans $7750 to $8400 so the resulting drop could be of the same height. If the current support levels hold, bitcoin price could recover to the shoulders around $8200 or past the head at $8400.

Stochastic is pointing up to show that there’s some bullish pressure left, but this oscillator is nearing overbought levels to reflect exhaustion among buyers. RSI is just starting to make its way out of the oversold region to signal a return in bullish momentum.

Market Factors

Traders had been expecting a strong rebound in bitcoin price after the tax deadline has passed, but it looks like market watchers are holding out for more clues. Sentiment has mostly been positive, coming off reports that big hedge funds are ready to place bets on the industry and the acquisition of Earn.com by Coinbase.

Dollar demand has been able to stay supported in recent sessions thanks to mostly upbeat economic data and hawkish Fed commentary. Easing geopolitical tensions have also lifted US bond yields, drawing traders back to the US currency as well.

Nonetheless, Q2 has historically been a positive quarter for bitcoin price and traders would likely try to take advantage of this tendency.


Author SARAH JENN | APRIL 18, 2018 | 4:31 AM


Posted by David Ogden Cryptocurrency Entrepreneur

Alan Zibluk – Markethive Founding Member

Bitcoin Price Technical Analysis for 17th April 2018 – Another Pullback Zone to Watch

Bitcoin Price Technical Analysis for 17th April 2018 – Another Pullback Zone to Watch

Bitcoin Price Key Highlights

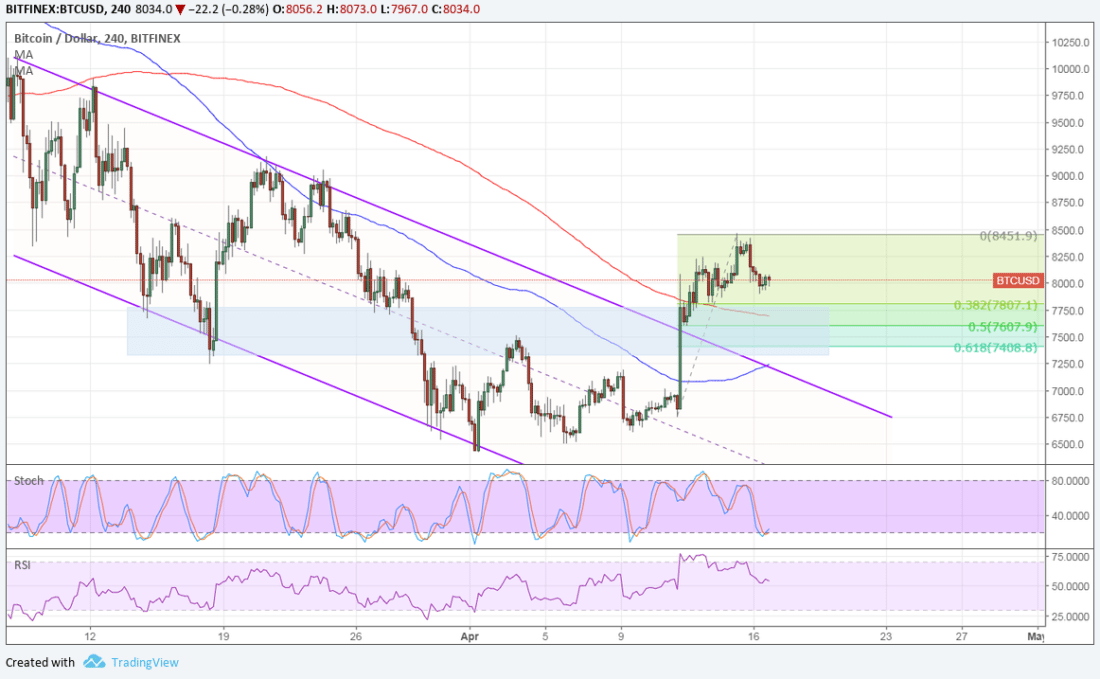
  • Bitcoin price recently broke out of its descending channel to show that an uptrend reversal is underway.

  • Price hit resistance at $8450 and is gearing up for a pullback, possibly until the broken resistance.

  • This lines up with several inflection points, so plenty of limit orders may be located in this area.

Bitcoin price looks ready for a pullback to a key area of interest visible on the 4-hour time frame.


Technical Indicators Signals


The 100 SMA is still below the longer-term 200 SMA on this time frame, though, so the path of least resistance is to the downside. In other words, the selloff is still likely to resume. Then again, the gap between the moving averages is narrowing to reflect slowing bearish pressure.


Bullish pressure could kick in once an upward crossover is completed. The 100 SMA is in line with the broken channel resistance to act as an additional inflection point. The 200 SMA lines up with the 50% Fibonacci retracement level and an area of interest that might be enough to keep losses at bay.


Stochastic is already indicating oversold conditions and looks ready to turn higher, drawing more buyers in. RSI, on the other hand, has plenty of room to fall so the correction could keep going for a bit longer.

Although bitcoin price is retreating from its recent climb, analysts have reason to believe that the gains could continue. For one, the second quarter of the year has historically been positive for cryptocurrencies and once the tax deadline has passed, investors could reopen their long positions.


Besides, Coinbase reportedly bought former bitcoin mining company 21 Inc, which is now known as Earn.com. This company has rebranded itself as a social media platform that incentivizes users to complete tasks in exchange for cryptocurrency rewards.


The deal was reportedly valued at over $100 million and reminds traders of the consistent developments in the space amid regulatory concerns.


Author:SARAH JENN | APRIL 17, 2018 | 3:46 AM


Posted by David Ogden Bitcoin Miner

Alan Zibluk – Markethive Founding Member
Bitcoin Price Technical Analysis for 11th April – Can Bulls Keep This Up

Bitcoin Price Technical Analysis for 11th April – Can Bulls Keep This Up

Bitcoin Price Technical Analysis for 11th April – Can Bulls Keep This Up?

Bitcoin Price Key Highlights

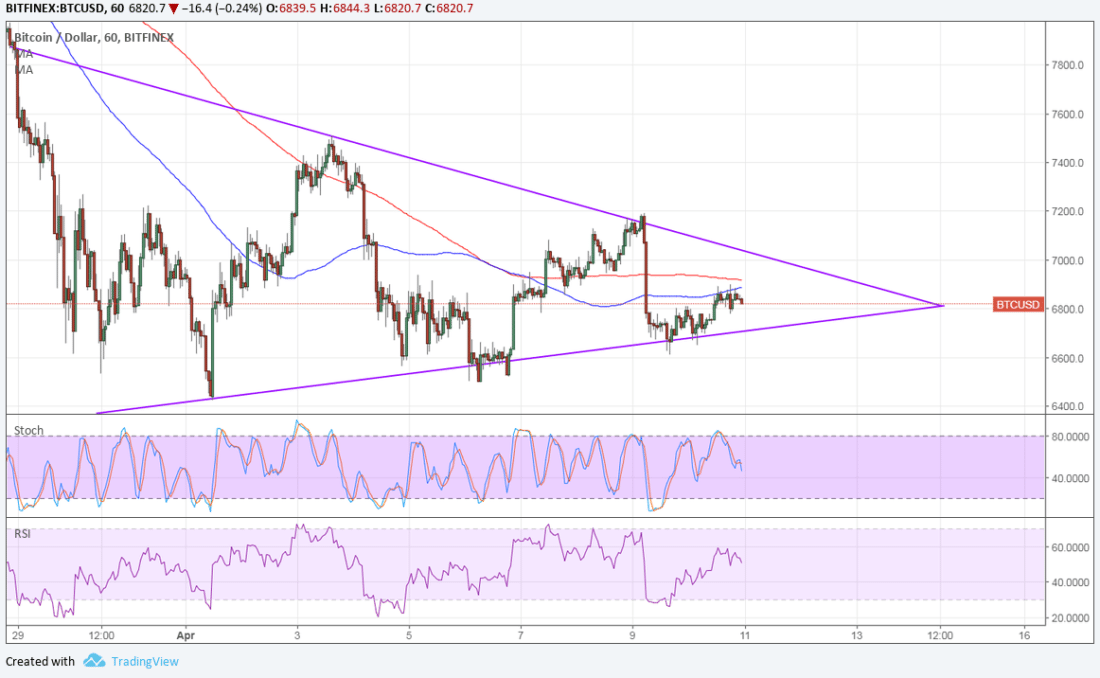
  • Bitcoin price has formed lower highs and higher lows to consolidate inside a triangle on its 1-hour chart.

  • Price found support at the bottom of its symmetrical triangle once more and looks ready for a test of the top.

  • Technical indicators mostly seem to be hinting at more gains ahead.

  • Bitcoin price bounced off the triangle bottom and could be gearing up for a test or break of the resistance.

Technical Indicators Signals

The 100 SMA is below the longer-term 200 SMA to signal that the path of least resistance is to the downside. However, the gap between the moving averages is narrowing to signal weakening bearish pressure and a potential return in buying momentum.

Stochastic is already on its way down to signal that bears are regaining control. In that case, another test of support could be due, especially since the 100 SMA is holding as dynamic resistance so far.

RSI, on the other hand, is moving higher to reflect the presence of bullish pressure. This could be enough to lead to a test of resistance near $7000 or perhaps even a break higher. Note that the triangle spans $6300 to $7800 so the resulting rally could be of the same height. Similarly, a break lower could lead to a drop of the same height.


Market Factors

The recent drop in bitcoin price is being pinned on the looming tax deadline, as the rush to close out positions led to a flurry of profit-taking. However, the sentiment in the industry remains mostly positive as the ban in India and Pakistan has been overshadowed by headlines of big hedge funds investing in the space.

Looking ahead, dollar demand could still play a role in bitcoin price direction as easing trade tensions between the US and China are starting to spur demand for riskier assets like cryptocurrencies. However, strong PPI has renewed focus on fundamentals leading up to the release of CPI and FOMC minutes later today.


Author SARAH JENN | APRIL 11, 2018 | 3:50 AM


Posted by David Ogden Entrepreneur

Alan Zibluk – Markethive Founding Member

Bitcoin Price Technical Analysis for 16th Feb – One More Hurdle to Clear

Bitcoin Price Technical Analysis for 16th Feb – One More Hurdle to Clear

Bitcoin Price Key Highlights

  • Bitcoin price has broken past its inverse head and shoulders pattern neckline to show that an uptrend is in the cards.

  • Price is hitting another upside barrier at its descending trend line, though, and this might prompt profit-taking.

  • Technical indicators are also suggesting that the rally is overdone.

  • Bitcoin price is testing the descending trend line on its 4-hour time frame, and moving past this hurdle could mean more gains.


Technical Indicators Signals
 

The 100 SMA is below the longer-term 200 SMA to signal that the path of least resistance is to the downside. This suggests that the downtrend is more likely to resume than to reverse.

The 200 SMA also lines up with the descending trend line to add to its strength as resistance. This means that it would take a strong catalyst to trigger and sustain an upside break.

Stochastic is indicating overbought conditions, though, so selling pressure could still pick up. Similarly, RSI is in the overbought region and looks ready to turn lower, so bitcoin price might follow suit.

Market Factors
 

Bitcoin price has drawn a lot of support from easing regulatory concerns, stemming from the US Senate hearing and remarks from South Korean officials suggesting that they are open to introducing something like BitLicense.

Recall that Commodity Futures Trading Commission Chair Christopher Giancarlo and Securities and Exchange Commission Chair Jay Clayton mentioned that they have no plans on banning bitcoin. Instead they plan on regulating the industry without quashing development.

More positive updates like these could help improve the sentiment in the industry. Apart from that, the continuation of risk-taking in higher-yielding assets like stocks and commodities has also benefitted bitcoin.

Besides, the move all the way to the $10,000 area of interest could bring more buying interest as this could signal an end of the correction. A sustained move past the next $12,000 area of interest could confirm that buying momentum is in play, attracting even more buyers.

Author SARAH JENN • FEB 16, 2018 • 05:02


Posted by David Ogden Entrepreneur
David Ogden Cryptocurrenct Entrepreneur

Alan Zibluk – Markethive Founding Member