
Bitcoin (BTC) Long Term Price Forecast
BTC/USD Long-term Trend: Ranging
Resistance levels: $7,200, $7,400, $7,600
Support levels: $6,400, $6,200, $6,000
The price of Bitcoin was range bound in the first week of November 2018. In retrospect, the digital currency was ranging above the $6,400 price level all through the month of October 2018. The major bearish event is that on October 11, the bears went deep into the $6,200 price level. While on October 15, the bulls had a price spike that reached the high of $7,600 but price pulled back to the low of $6,500.
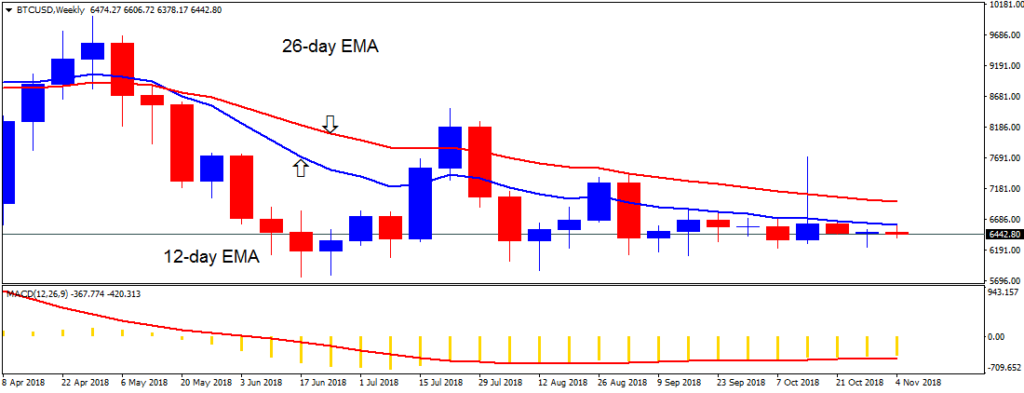
That was why we had a price ranging above the $6,400 price level. On November 7, the price reached a high of $6,565.66 but was resisted. The digital currency was in a downward trend after the resistance at $6,600 price level. The digital currency is likely to fall because price is in the bearish trend zone. Meanwhile, the price of Bitcoin is below the 12-day EMA and the 26-day EMA which indicates that a bearish trend is ongoing. The MACD line and the signal line are below the zero line which indicates a sell signal.
By Azeez M – November 10, 2018

Alan Zibluk Markethive Founding Member