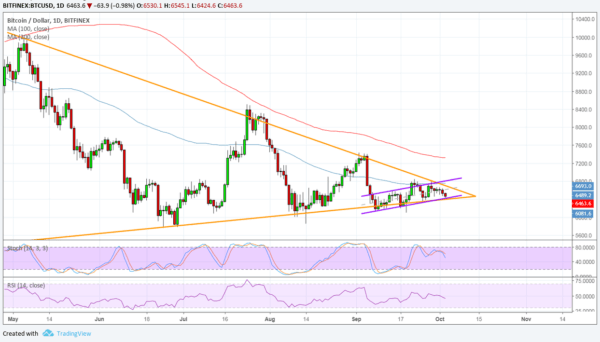
Bitcoin BTC/USD Long-Term Triangle Break Soon
Bitcoin has tumbled back to the bottom of its triangle consolidation pattern visible on the daily time frame but might be due for a break soon. The price is near the peak of its triangle after all, so it would need to pick a longer-term direction from here.
The 100 SMA is below the longer-term 200 SMA on this daily time frame to hint that the path of least resistance is to the downside. In other words, a break lower is more likely to happen than an upside breakout. In that case, Bitcoin could slump by the same height as the chart pattern, which spans $5,800 to $10,000.
Stochastic is pointing down, also indicating that sellers have the upper hand. This oscillator is just making its way out of the overbought zone, which means that there’s plenty of time for bears to stay in control. RSI appears to be treading sideways, reflecting current range-bound conditions and barely offering directional clues.

Bitcoin appears to have shed its gains on reports that the only Bitcoin investment trust is deeply in the red. Shares of Grayscale Bitcoin Investment Trust (GBTC) are down roughly 80% since price peaked late last year, hardly encouraging news for new investors.
Nonetheless, analysts believe that a big rally might be in order as the Lightning Network shows more signs of growth. This allows a layer to be built on top of the blockchain in order to process smaller transactions. This also speeds up processing while maintaining network security. For many, this could aid in the mainstream adoption of Bitcoin, thereby shoring up volumes and activity in the long run.
However, investors appear to be holding out for an actual positive development to break price out of its long-term consolidation and sustain any potential gains. Many had hoped it would be the SEC decision on Bitcoin ETF applications but the regulator has simply extended the comment period so far.
SARA JENN · OCTOBER 3, 2018 · 1:30 AM
Alan Zibluk Markethive Founding Member
