Tag Archives: bitcoin price

Bitcoin BTC Daily Price Forecast November 27

Bitcoin (BTC) Daily Price Forecast – November 27

Bitcoin (BTC) Daily Price Forecast – November 27

BTC/USD Medium-term Trend: Bearish

Resistance Levels: $6,800, $6,900, $7,000

Support levels: $3,600, $3,400, $3,200

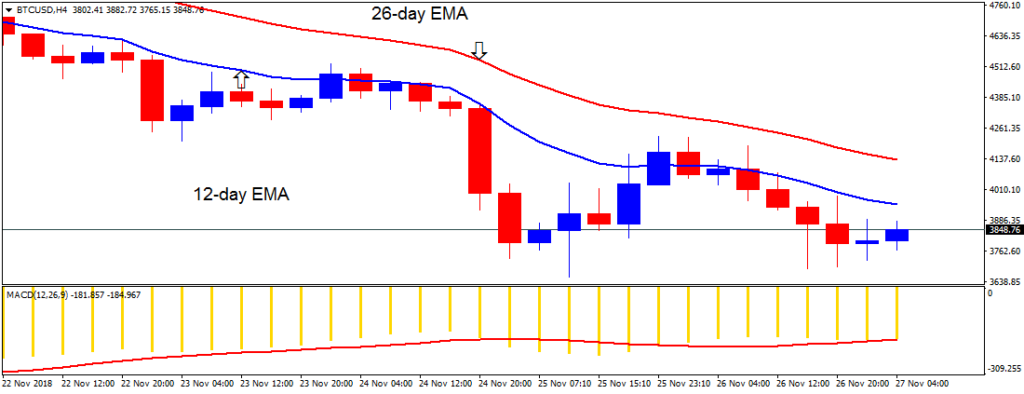
Yesterday, November 26, the price of Bitcoin was in a bearish trend. On November 25, the digital currency fell to the low of $3,774.80 and made a bullish movement to the 12-day EMA. On November 26, the crypto’s price was resisted at the 12-day EMA and it fell to the low of $3835. Price is likely to make another bullish movement to the 12-day EMA.

However, for the digital currency to resume its uptrend the crypto must break the 12-day EMA and the 26-day EMA to the upside and remain above it. Meanwhile, the crypto's price is below the 12-day EMA and the 26-day EMA indicating that price is in the bearish trend zone. Also, the MACD line and the signal line are below the zero line which indicates a sell signal.

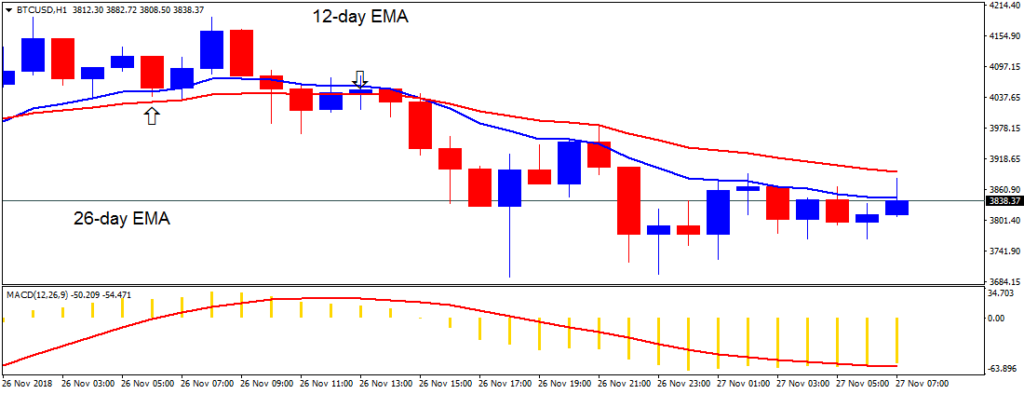
On the 1-hour chart, the price of Bitcoin was in a sideways trend. On November 25, the crypto's price broke the 12-day EMA and the 26-day EMA to the upside and remain above it. On November 26, the crypto ‘s price broke the EMAs to the downside which led to the continuation of the bearish trend.

Courtesy of  BitcoinExchangeGuide.com

Alan Zibluk Markethive Founding Member

Bitcoin BTC Price Watch – Watch This Triangle for Directional Clues

Bitcoin (BTC) Price Watch - Watch This Triangle for Directional Clues

Bitcoin (BTC) Price Watch – Watch This Triangle for Directional Clues

Bitcoin Price Key Highlights


  • Bitcoin price is still stuck in consolidation, forming higher lows and lower highs inside a symmetrical triangle on the short-term chart.

  • Price is approaching the peak of this formation so a breakout might be due soon, providing longer-term directional clues.

  • Technical indicators are giving mixed signals, although there seems to be some bearish pressure in play.

Bitcoin price is consolidating inside a symmetrical triangle on the short-term charts while traders decide which direction to take.


Technical Indicators Signals

The 100 SMA crossed below the longer-term 200 SMA on this time frame, indicating that the path of least resistance is to the downside. In other words, support is more likely to break than to hold, possibly leading to a slide that’s at least the same height as the triangle. This pattern spans $6,640 to around $$7,000.

Stochastic is on the move down to show that sellers are in control and could push for a break below the triangle bottom. RSI also seems to be moving south to signal that bearish pressure could stay in play as the oscillator has plenty of room to move down before hitting oversold levels.

The recent surge in bitcoin price is being pinned on the Tether selloff, although the launch of Fidelity’s institutional platform might be a bigger factor sustaining longer-term gains. After all, this could open bitcoin and ethereum to stronger volumes and increased trading activity from bigger market players.

A candle closing past the $6,750 triangle resistance could be enough to signal an upside break and a continuation of the rally from the larger triangle breakouts. A break below the $6,675 level, on the other hand, could lead to a test of the nearby support zones, although it’s worth noting that bulls are strongly defending the lows by buying on dips.


SARAH JENN | OCTOBER 17, 2018 | 3:54 AM

Alan Zibluk Markethive Founding Member

Bitcoin BTC Price Watch – Nearby Upside Targets

Bitcoin (BTC) Price Watch - Nearby Upside Targets

Bitcoin (BTC) Price Watch – Nearby Upside Targets


Bitcoin Price Key Highlights

  • Bitcoin price continues to hover above its ascending channel support on the 4-hour time frame.

  • Price appears to be consolidating after the bounce but remains on track towards testing the next upside targets.

  • The 38.2% extension level seems to have kept some gains in check, possibly sending price back down to support once more.

Bitcoin price is finding support at the bottom of its rising channel but has hit a roadblock on the first Fib extension.
 

Technical Indicators Signals

The 100 SMA is below the longer-term 200 SMA on this time frame to signal that the path of least resistance is to the downside. In other words, the selloff is more likely to resume than to reverse. Then again, the gap between the moving averages has narrowed to indicate a possible bullish crossover and return in bullish momentum.

Stochastic is still on the move up to indicate that buyers have the upper hand, but the oscillator is approaching overbought levels to reflect exhaustion. Turning back down could mean a pickup in selling pressure and a dip back to the channel support near $6,500. RSI continues to cruise sideways to reflect consolidation but has been on the move up as well.

A continuation of the climb could take bitcoin price to the 50% extension at the mid-channel area of interest or $6,700 mark. The 78.6% extension lines up with the top of the channel and the swing high, serving as a potential take-profit level as well. Stronger bullish momentum could take bitcoin price past the channel top and onto the full extension at $6,956.30.

A handful of analysts are calling a bottom on bitcoin, likely setting the tone for a strong rebound before the end of the year. A survey by Fundstrat revealed that 54% of institutional traders are optimistic about the digital currency’s prospects, although some say that it won’t reach $9,000 by December.


SARAH JENN | OCTOBER 5, 2018 | 4:02 AM

Alan Zibluk Markethive Founding Member

Bitcoin BTCUSD Long-Term Triangle Break Soon

Bitcoin  BTC/USD Long-Term Triangle Break Soon

Bitcoin BTC/USD Long-Term Triangle Break Soon


Bitcoin has tumbled back to the bottom of its triangle consolidation pattern visible on the daily time frame but might be due for a break soon. The price is near the peak of its triangle after all, so it would need to pick a longer-term direction from here.

The 100 SMA is below the longer-term 200 SMA on this daily time frame to hint that the path of least resistance is to the downside. In other words, a break lower is more likely to happen than an upside breakout. In that case, Bitcoin could slump by the same height as the chart pattern, which spans $5,800 to $10,000.

Stochastic is pointing down, also indicating that sellers have the upper hand. This oscillator is just making its way out of the overbought zone, which means that there’s plenty of time for bears to stay in control. RSI appears to be treading sideways, reflecting current range-bound conditions and barely offering directional clues.

Bitcoin appears to have shed its gains on reports that the only Bitcoin investment trust is deeply in the red. Shares of Grayscale Bitcoin Investment Trust (GBTC) are down roughly 80% since price peaked late last year, hardly encouraging news for new investors.

Nonetheless, analysts believe that a big rally might be in order as the Lightning Network shows more signs of growth. This allows a layer to be built on top of the blockchain in order to process smaller transactions. This also speeds up processing while maintaining network security. For many, this could aid in the mainstream adoption of Bitcoin, thereby shoring up volumes and activity in the long run.

However, investors appear to be holding out for an actual positive development to break price out of its long-term consolidation and sustain any potential gains. Many had hoped it would be the SEC decision on Bitcoin ETF applications but the regulator has simply extended the comment period so far.


SARA JENN · OCTOBER 3, 2018 · 1:30 AM

Alan Zibluk Markethive Founding Member

Bitcoin BTC Still Stuck in Consolidation Breakout Soon?

Bitcoin (BTC)  Still Stuck in Consolidation, Breakout Soon?

Bitcoin (BTC) Still Stuck in Consolidation, Breakout Soon?
 

Bitcoin Price Key Highlights

  • Bitcoin price is still stuck inside its triangle consolidation pattern on the 1-hour time frame.

  • Price is nearing the peak of its formation so a breakout could take place soon.

  • Technical indicators are still giving mixed signals on which direction the breakout might go.

Bitcoin price is nearing the peak of its consolidation pattern, which means that a breakout is bound to happen soon.
 

Technical Indicators Signals

The 100 SMA is above the longer-term 200 SMA for now to indicate that the path of least resistance is to the upside. In other words, support is more likely to hold than to break or an upside break might be more likely than a breakdown. In that case, bitcoin price could be looking at a rally that’s at least the same height as the chart formation, which spans $6,100 to $7,300.

Stochastic is heading higher so bitcoin price could also follow suit while buyers have the upper hand. However, the oscillator is nearing overbought levels to indicate bullish exhaustion and a possible return in selling pressure. RSI, meanwhile, is cruising sideways to reflect consolidation. The moving averages have also been consolidating to signal range-bound conditions.

Bitcoin (BTC)  Still Stuck in Consolidation, Breakout Soon?

Bitcoin price has had a slew of positive developments in the previous week to keep it supported but investors seem to be holding out for more catalysts to sustain a climb this time. Momentum has been on bitcoin’s side but it would still need a few more positive developments to draw more buyers in.

The launch of bitcoin futures on ICE could bring volumes in, but keep in mind that CME futures were being blamed for the drop in bitcoin price late last year. After all it would allow investors to take short bets on the digital asset, possibly taking it for a break below consolidation onto new lows.


SARAH JENN | OCTOBER 2, 2018 | 4:12 AM

Alan Zibluk Markethive Founding Member

Bitcoin BTC Price Analysis – Bulls Stay In Control

Bitcoin (BTC) Price Analysis - Bulls Stay In Control

Bitcoin (BTC) Price Analysis – Bulls Stay In Control

Bitcoin is still inside its symmetrical triangle but continues to trend higher short-term.

BITCOIN PRICE ANALYSIS

Bitcoin still seems to be stuck inside its symmetrical triangle consolidation on the 4-hour chart but continues to climb inside a rising channel on the shorter-term time frames. Price is pulling back to the channel support and a bounce could take it up to the resistance.

The 100 SMA is below the longer-term 200 SMA, though, so the path of least resistance is to the downside. In other words, the selloff is more likely to resume than to reverse. Then again, the gap between the two is narrowing to signal that bearish pressure is slowing and that an upward crossover could be due.

In that case, bullish momentum could pick up and take price past the top of the channel and triangle around $6,800. Note that the triangle spans around $2,500 in height so the resulting uptrend could be of at least the same size.

Stochastic is pointing back up to indicate the return of bullish momentum without even seeing oversold conditions. RSI is treading sideways to signal consolidation but seems to be crawling slightly higher as well. If resistance holds, however, bitcoin could slump back to the triangle bottom at $6,200.


By Rachel Lee On Oct 1, 2018

Alan Zibluk Markethive Founding Member

BITCOIN PRICE CHANGED BY -228 TODAY


BITCOIN PRICE CHANGED BY -2.28 TODAY

As at 2018-09-29 average Bitcoin price is 6550.72493333 USD, 1 BTC, 30.0321324 ETH.

It’s noteworthy that is issued into circulation Bitcoin.

Bitcoin BTC/USDT on Binance exchange is 6510.84. The trading volume on Binance is 274818013.32.

At the same time Bitcoin BTC/QC on ZB exchange is 6513.12. The trading volume on ZB is 69895898.43.

Bitcoin BTC/USDT on OKEx exchange is 6508.83. The trading volume on OKEx is 209122252.13.

Bitcoin BTC/USDT on Huobi exchange is 6513.50. The trading volume on Huobi is 95030560.70.

Bitcoin BTC/USDT on Bitforex exchange is 6515.49. The trading volume on Bitforex is 188305436.89.

In this regard, 24 hour trading volume is 4467848631 USD or 682038 BTC. At the same time Bitcoin market capitalization is 113280212358 USD or $17292775 BTC.

Bitcoin average change within 24 hour is -2.28 against USD, 0 against BTC, 2.69 against ETH. Weekly report: -2.33 against USD, 0 against BTC, 7.99 against ETH. Monthly report: -6.97 against USD, 0 against BTC, 22.87 against ETH.

BITCOIN PRICE CHANGED BY -2.28 TODAY

Alan Zibluk Markethive Founding Member

Bitcoin price analysis – BTCUSD rangebound under 6400 but further losses are limited

Bitcoin price analysis - BTC/USD rangebound under $6,400, but further losses are limited

Bitcoin price analysis – BTC/USD rangebound under $6,400, but further losses are limited

  • BTC/USD stays below critical support, but the downside momentum is fading away.

  • New Tether coins hit the market, BTC did not react.

BTC/USD is changing hands at $6,388, consolidating losses incurred at the beginning of the week. The digital currency No. 1 touched $6,327 low on Tuesday, though the bearish momentum has faded away, allowing for the recovery towards the key resistance area, created by 23.6% Fibo retracement for the downside movement from September 4 peak.
 

Bitcoin's technical picture

Looking technically, BTC/USD is recovering slowly from September 8 low reached at $6,114. This trend remains untouched as long as the price stays above the upside trendline currently at $6,280. Once it is broken, $6,000 will come into focus, threatening to push BTC/USD back on the bearish track.

Meanwhile, from the short-term point of view, a sustainable move below $6,400 looks nasty. If this ground is not regained soon, the selling pressure may intensify and push the price towards the above-said critical trend line support.

The next hurdle is created by SMA40 (4-hour chart) above $6,500 and $6,600 (38.2% Fibo retracement). A sustainable movement higher will allow proceeding towards $6,650 (SMA200, 4-hour chart) and psychological $6,700.
 

Tether movements

Meanwhile, crypto community noticed that the amount of Tether in circulation increased by $12.89M. The newly minted coins were transferred to Bitfinex, the fourth largest cryptocurrency exchange by trading volumes. However, this Tether issuance did not influence Bitcoin's momentum in any noticeable way.


Tanya Abrosimova

FXStreet


Alan Zibluk Markethive Founding Member

Bitcoin BTC Price Watch – Back to Support Yet Again

Bitcoin (BTC) Price Watch -  Back to Support Yet Again!

Bitcoin (BTC) Price Watch – Back to Support Yet Again!

Bitcoin Price Key Highlights


  • Bitcoin price has formed higher lows and lower highs to trade inside a triangle pattern on its 4-hour time frame.

  • Price got rejected on a test of resistance once more and a move to support appears to be taking place.

  • Technical indicators are suggesting that further declines could be in the cards.

Bitcoin price bounced off the top of its triangle consolidation pattern and is gearing up for another test of support.


Technical Indicators Signals


The 100 SMA is below the longer-term 200 SMA to signal that the path of least resistance is to the downside. In other words, support is more likely to break than to hold. Price is currently testing the 100 SMA dynamic inflection point and might be due for further losses if it breaks below this level or the $6,250 triangle bottom.

Stochastic is also heading south so bitcoin price might follow suit while sellers have the upper hand. This oscillator is nearing oversold levels, though, so bears might be feeling exhausted soon. RSI is pointing down and has more room to fall before hitting oversold levels, so sellers could stay in control for a bit longer.

The chart pattern spans $6,000 to around $8,250 so a break lower could be followed by a drop of the same height. Similarly an upside break could lead to a rally that’s the same height as the triangle.

Bitcoin price has drawn support from the SEC decision to open the comment period for the proposed rule change to list the bitcoin ETF by VanEck/SolidX on an exchange. This keeps traders’ hopes up that an approval may be in the works sooner or later as it managed to avoid a quick rejection.

Meanwhile, there appears to be no major catalyst that has spurred the sharp tumble, apart from profit-taking. Some point to the BIS report that regulation has been a driving factor for bitcoin price also.

SARAH JENN | SEPTEMBER 25, 2018 | 4:34 AM

Alan Zibluk Markethive Founding Member

Bitcoin BTC Price Watch – Make Or Break At 7000

Bitcoin (BTC) Price Watch - Make Or Break At $7,000

Bitcoin (BTC) Price Watch – Make Or Break At $7,000

Bitcoin Price Key Highlights

  • Bitcoin price is once again attempting to break past the key $7,000 barrier on its climb.

  • If it does, bullish pressure could kick in and complete the formation of a long-term double bottom reversal pattern.

  • The pattern’s neckline would be at the $8,400 mark and a break higher could spur a prolonged rally.

Bitcoin price is back to the key $7,000 mark and a strong upside break could confirm that a big rebound is in order.
 

Technical Indicators Signals

The 100 SMA is below the longer-term 200 SMA on this time frame to signal that the path of least resistance is still to the downside. In other words, resistance is more likely to hold than to break.

However, the gap between the two indicators has narrowed significantly to indicate that a bullish crossover may be in the works. In that case, more buying pressure could be seen once completed, giving bitcoin price enough energy to sustain a move past $7,000.

This would put in on track towards testing the neckline around $8,400 to $8,500 and complete a large double bottom pattern. This reversal formation would span around $2,700 in height, which suggests that the resulting move could be roughly the same size.

RSI is still heading lower for now, though, so sellers might have the upper hand. Similarly stochastic is moving south so bitcoin price could follow suit while sellers stay in control. Sustained bearish momentum might even lead to another test of the bottoms at $5,800.

BTCUSD Chart from TradingView

However, the mood is somewhat positive in the industry as investors await the SEC decision on pending bitcoin ETF applications. To top it off, risk appetite has been evident in global financial markets thanks to developments in NAFTA and Brexit.

It might take an industry-specific catalyst to sustain any potential rallies, though, and it’s likely that the regulator’s ruling could do the trick. Approval could bring stronger volumes and increased activity for bitcoin and its peers.


Sarah Jenn – NewsBTC – 1 hour ago

Alan Zibluk Markethive Founding Member