Tag Archives: bitcoin bulls

The Crypto Daily The Movers and Shakers 240719


The Crypto Daily – The Movers and Shakers 24/07/19

The bears eye a 4th day in the red, with sub-$8,000 levels for Bitcoin investors likely to cause some angst for the broader market.

Bitcoin slid by 4.57% on Tuesday. Following on from a 2.29% fall from Monday, Bitcoin ended the day at $9,859.

A particularly bearish morning saw Bitcoin slide from an early intraday high $10,330.9 to an early afternoon intraday low $9,820.

Steering clear of the major resistance levels, Bitcoin fell through the first major support level at $10,188 and second major support level at $10,048.

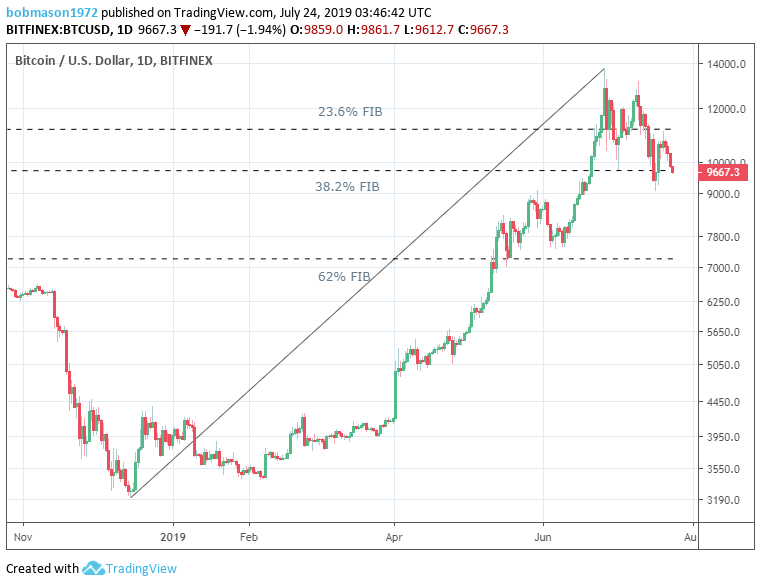
Holding above the 38.2% FIB of $9,734 and third major support level at $9,657 was the only positive from the session.

Finding support through the afternoon, Bitcoin recovered to $10,200 levels before sliding back to sub-$10,000 levels.

It was Bitcoin’s first sub-$ 10,000-day end since 17th July.

Bitcoin’s market cap slid back from $183bn levels to $173.02bn at the time of writing.


The Rest of the Pack

Across the rest of the top 10 cryptos, it was a mixed bag for the majors on the day.

Bucking the trend on the day were Bitcoin Cash SV and EOS. Bitcoin Cash SV rallied by 2%, while EOS rose by 0.91%.

It was red for the rest of the pack, however. Tron’s TRX led the way down on the day, sliding by 8.95%.

Litecoin (-5.36%) and Binance Coin (-4.51%) also saw heavy losses on the day. It was a somewhat better story for Ethereum, which fell by 2.39%.

Bitcoin’s dominance eased back to 64% levels before recovering to 65% levels. Bearish sentiment across the broader market outweighed the effects of Bitcoin’s losses over the course of the last day.

On the day, the total crypto market cap slide from $281.9bn levels to $265.97bn at the time of writing


This Morning,

At the time of writing, Bitcoin was down by 1.94% to $9,667.3. A particularly bearish start to the day saw Bitcoin fall from a morning high $9,861.7 to a low $9,612.7

The early sell-off saw Bitcoin fall through the 38.2% FIB of $9,734 and first major support level at $9,675.70.

Bitcoin left the major resistance levels untested.

Elsewhere, Bitcoin Cash ABC (-4.02), Binance Coin (-4%), and Bitcoin Cash SV (-4.69%) also saw heavy losses.


The rest of the pack weren’t far behind, in the early part of this morning. Ethereum also struggled, down 3.77% at the time of writing.
For the Day Ahead

A move back through the 38.2% FIB of $9,734 would bring $10,000 levels back into play. Bitcoin would need the support of the broader market, however, to break out from the 38.2% FIB.

In the event of a broad-based crypto rebound, a move back through to $10,000 would bring the first major resistance level at $10,186.6 into play.

We would expect Bitcoin to fall well short Tuesday’s high $10,330.9, however.

Failure to move back through the 38.2% FIB of $9,734 could see Bitcoin fall deeper into the red. A fall through to $9,500 levels would bring the second major support level at $9,492.4 in play.

Barring an extended crypto sell-off through the day, the second major support level should limit any downside on the day.


Bob Mason

Jul 24, 2019 04:04 AM GMT

Alan Zibluk Markethive Founding Member

Analysts Alex Kruger and Josh Rager give their Bitcoin Predictions

Analysts Alex Kruger and Josh Rager give their Bitcoin Predictions

Analysts Alex Kruger and Josh Rager give their Bitcoin Predictions


Cryptocurrency analyst and economist Alex Krüger says investors should welcome the current withdrawal of Bitcoin and points out that Bitcoin will increase faster and sharper.

Bull market corrections are unavoidable and should be welcome. Assets that go too far up too fast tend to crash the hardest. As everyone who speculated with the price of bitcoin during 2017 and 2018 well knows.

In the short term, analyst Josh Rager points out that BTC ‘s previous support on the one-hour chart shows resistance, suggesting that Bitcoin could fall below $10,000.

$BTC Breaking down to support zone

On 1 hr chart showing top of support zone now acting as resistance

Not a great sign for bulls and want to see price break back up in neutral territory

Continue to watch this area for a break $,10,189 will lead back down to 4-digit BTC

Crypto Money Market

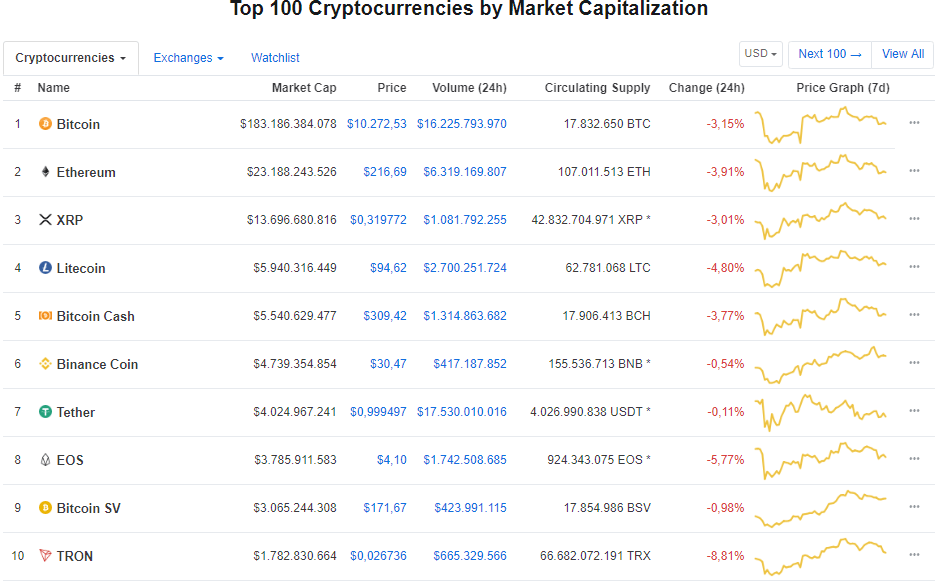
When we look at the price outlook of the crypto money market, we see that Bitcoin experienced a 3% decrease. Bitcoin is traded for $ 10,272. The volume in the last 24 hours is around 16 billion dollars. The market value of Bitcoin is around 183 billion dollars at the time of writing.

When we look at Ethereum, the king of the Altcoins, we see that it traded at $216 with a decline of about 4%. Ripple’s XRP is also down and is trading at $ 0.3

Looking at the coins in the top ten of the crypto currency world, Litecoin traded at $ 94, down 4.80%, Bitcoin Cash at $ 309, down 3.77%, and Binance Coin at $ 30.47, down 0.54% as seen in the

EOS, the number eight in the crypto currency world, traded at $ 4.1 with a decline of 5.77%, while Bitcoin SV, which has seen an effective increase in recent days, is trading at $ 171 with a 0.98% drop. Finally, Tron is trading at $ 0.026, down 9% at the time of writing.


BY TULIKA JAIN ON JULY 23, 2019

Alan Zibluk Markethive Founding Member
Bitcoin is a rollercoaster ride

Bitcoin is a rollercoaster ride

hen we started work on this article, we were going to talk about the explosive growth in Bitcoin value. But as we prepared to publish, the cryptocurrency experienced a massive devaluation that could have serious implications for investors.

The highs of cryptocurrency investment

In December 2018, Bitcoin (BTC) reached its lowest point of the year, with each virtual coin worth about $3,200. Over the next sixth months, demand helped to raise values significantly.

By the end of May, BTC breached the $10,000 mark. Four weeks later and coins were worth $12,867. The currency quadrupled in value over the course of a few months, helping to create some seriously rich cryptocurrency investors.

The lows of cryptocurrency investment

Within the span of a few hours today though, everything changed. In the span of one hour, Bitcoin lost $1,000 in value. By the end of the day, BTC was trading below $9,500.
This is not a record low, but around $10 billion was lost from the BTC market in just one day.

The problems with cryptocurrencies

Cryptocurrencies like Bitcoin, Ethereum and Ripple are designed to be free of the control by central banks like the Federal Reserve or the Bank of England. As a result, these virtual currencies are free from the control placed on traditional ‘fiat’ currencies like US Dollars, British Pounds and Euros.

But it is precisely this lack of control that allows the massive swings in value as we have seen recently. Without the normal financial mechanisms used to stabilise currency value fluctuations, Bitcoin can swing wildly. Although unlikely, it is entirely possible that BTC could be worth $25,000 tomorrow, and nothing at all by the end of the week.

Gaming the system?

Without central bank controls and foreign exchange regulators, Bitcoin value is open to manipulation by unscrupulous investors. It is entirely possible that the value of Bitcoin has been artificially inflated, allowing speculators to sell their coins for a massive profit. And once the value crashes, they can buy more BTC, wait for the value to increase, and then sell for another large profit.

For most people, Bitcoin manipulation isn’t a problem because they simply don’t use them. However, many financial experts believe that cryptocurrencies will become more mainstream – Facebook’s Libra coin is sure to gain plenty of attention once it finally launches.

Trading Bitcoin

If you’re interested in trading Bitcoin, you should seek professional guidance from an independent financial adviser. You should also ensure your computer is properly protected by an anti-malware tool to ensure your digital wallet (used to store cryptocurrency) cannot be stolen by cybercriminals. You can download a free Panda Dome trial here.

For everyone else, you can expect to see more headlines about the crazy Bitcoin rollercoaster in the near future.


July 22, 2019

Alan Zibluk Markethive Founding Member
Bitcoin BTC Price Weekly Forecast – Approaching Next Crucial Break

Bitcoin (BTC) Price Weekly Forecast - Approaching Next Crucial Break

Bitcoin (BTC) Price Weekly Forecast – Approaching Next Crucial Break

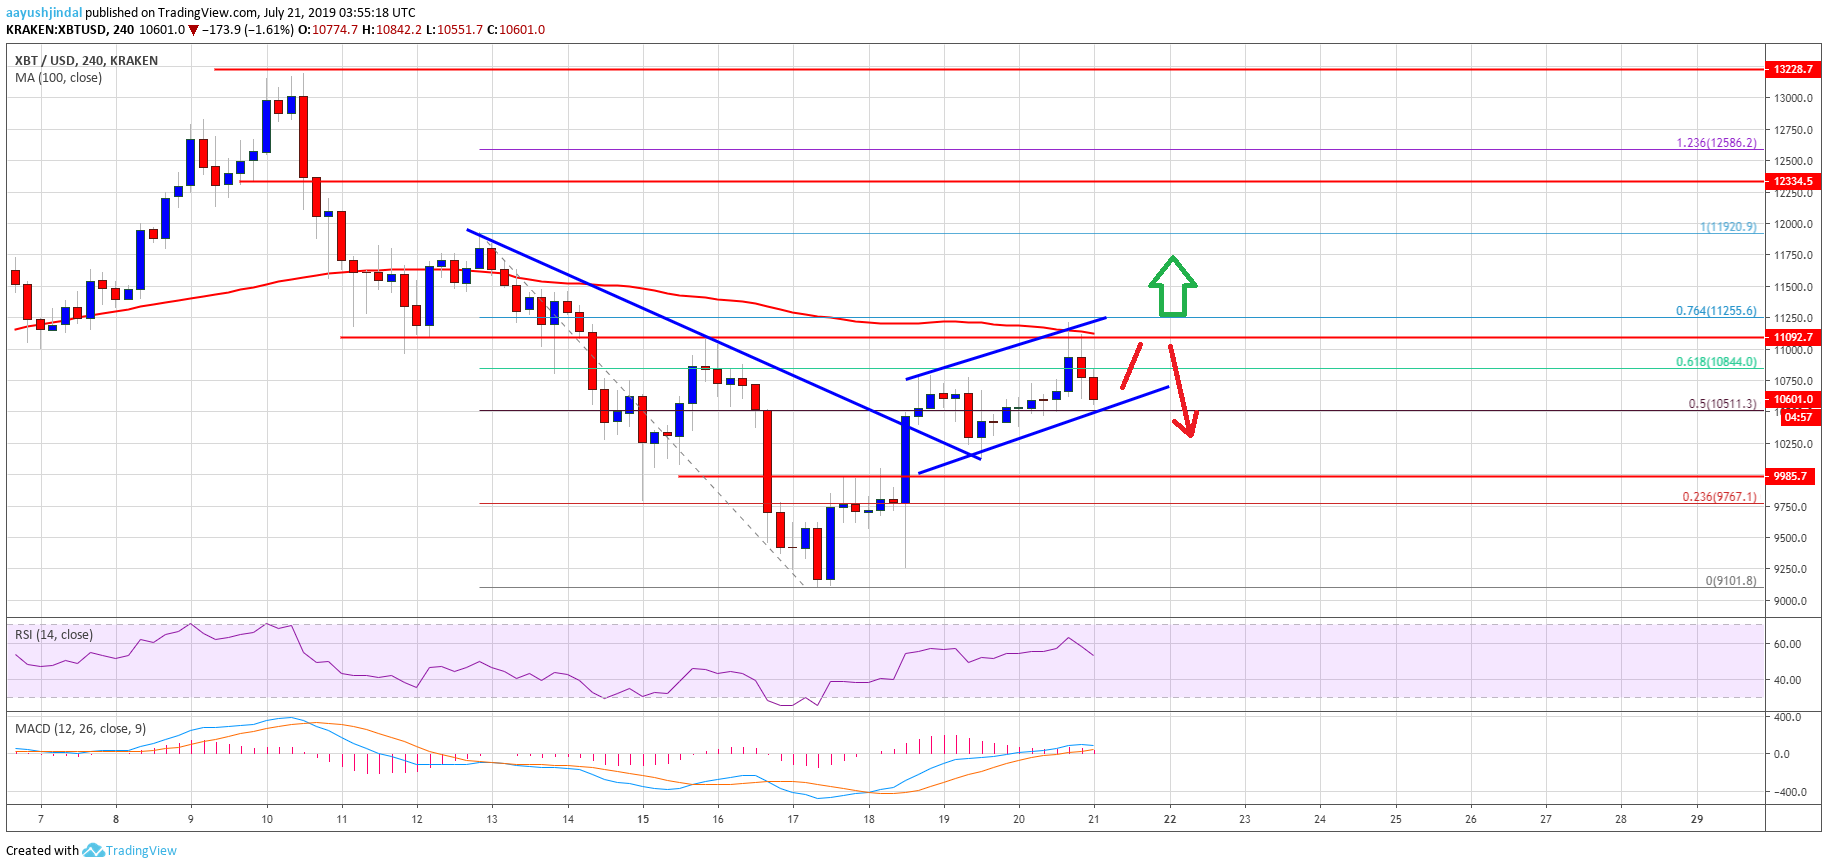
  • There was a solid upside correction initiated from the $9,100 swing low against the US Dollar.

  • The price gained traction after it broke the key $10,000 resistance area and traded towards $11,250.

  • There was a break above a major bearish trend line with resistance at $10,400 on the 4-hours chart of the BTC/USD pair (data feed from Kraken).

  • The pair tested a crucial resistance near $11,250 and it is currently correcting lower.

Bitcoin price is showing positive signs above the $10,250 support against the US Dollar. However, BTC must break the $11,250 resistance zone to continue higher in the near term.
 

Bitcoin Price Weekly Analysis (BTC)

This past week, bitcoin price extended its decline below the $10,000 support against the US Dollar. The BTC/USD pair even broke the $9,500 support and settled below the 100 simple moving average (4-hours). Finally, the price traded close to the $9,000 and formed a swing low near $9,100. A support base is formed above $9,200 and the price started an upside correction.

The recent wave was positive as the price broke the $10,000 and $10,250 resistance levels. The price even surpassed the 50% Fib retracement level of the last major slide from the $11,920 swing high to $9,101 swing low. Moreover, there was a break above a major bearish trend line with resistance at $10,400 on the 4-hours chart of the BTC/USD pair. The price climbed above the $10,800 resistance and even spiked above the $11,000 level.

However, the upward move was capped by the $11,250 resistance area and the 100 simple moving average (4-hours). The 76.4% Fib retracement level of the last major slide from the $11,920 swing high to $9,101 swing low also acted as a Looking at the chart, bitcoin price clearly tested a crucial resistance near $11,250. Therefore, a clear break above $11,250 is needed for the bulls to gain control in the coming sessions.

Major Resistance Level – $11,250strong resistance. As a result, the price started a downside correction below the $11,000 level. At the outset, it seems like there is a rising channel forming with support near $10,500.

If there is a downside break below the channel support, the price could decline towards the $10,250 or $10,000 support area. On the upside, the main resistance is near the $11,250 level and the 100 simple moving average (4-hours). A successful close above the $11,250 is must for more gains. If not, the price could start a fresh decrease below $10,500.

Technical indicators

4 hours MACD – The MACD for BTC/USD is struggling to gain traction in the bullish zone.

4 hours RSI (Relative Strength Index) – The RSI for BTC/USD is still above the 50 level.

Major Support Level – $10,250


By Aayush Jindal


Alan Zibluk Markethive Founding Member
35 Bitcoin Price Drop to 9100 is Historically Natural Don’t Worry – Analyst

35% Bitcoin Price Drop to $9,100 is Historically Natural, Don't Worry - Analyst

35% Bitcoin Price Drop to $9,100 is Historically Natural, Don’t Worry – Analyst

Bitcoin and the aggregated crypto markets have been incurring significant volatility as of late that has made it increasingly unclear as to which direction BTC is heading and has even made it difficult to know whether bulls or bears are in control.

Although Bitcoin’s recent drop to $9,100 certainly signaled that the crypto’s bears have significant strength, the subsequent price surge past $10,000 signals that bulls are still in control, and one analyst believes that the recent pullback is both natural and necessary for the uptrend to continue.

Bitcoin Climbs Towards $10,400 as Bulls Step Up

At the time of writing, Bitcoin is trading down slightly at its current price of $10,370, which is down slightly from its daily highs of roughly $10,700.

Although its price has dropped from its daily highs, it is important to note that it is trading up significantly from its weekly lows of $9,100 that were set earlier this week.

The positive reaction to the recent dip into the four-figure price region signals that buyers are still in control, and that there is a significant amount of buying support that exists below $10,000.

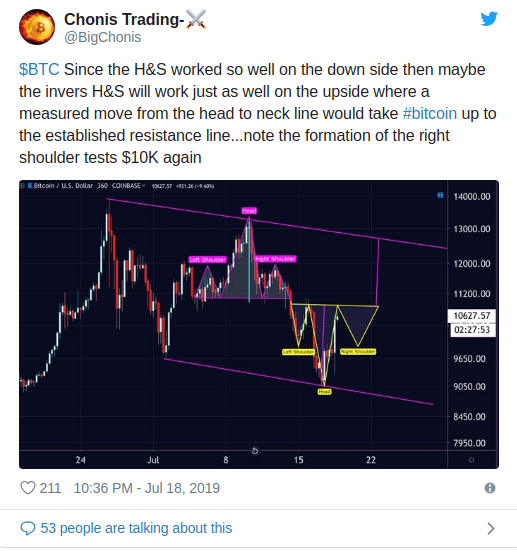
While looking at Bitcoin’s near-term price action, analysts are noting that the cryptocurrency might be forming an inverse head and shoulders pattern, which could mean that BTC will drop slightly before surging up towards $13,000.

“$BTC Since the H&S worked so well on the down side then maybe the inverse H&S will work just as well on the upside where a measured move from the head to neck line would take #bitcoin up to the established resistance line…note the formation of the right shoulder tests $10K again,” Chonis Trading, a popular crypto analyst, noted in a recent tweet.

BTC’s Latest Pullback Could Be Entirely Natural

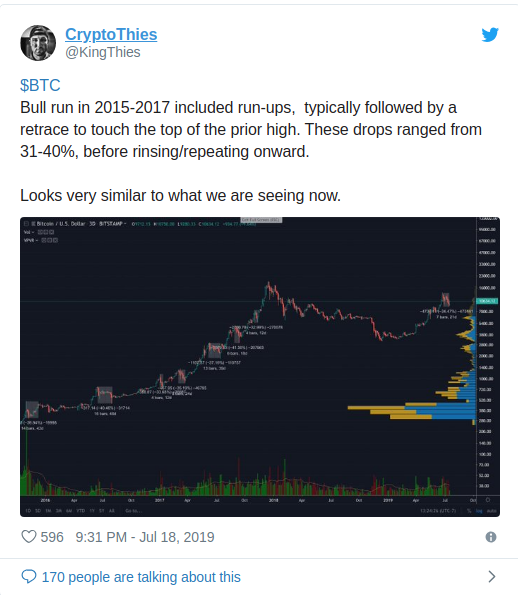
Although the recent pullback marked the end of the recently incurred bull market in the mind of many investors, one prominent analyst is now explaining that 30-40% pullbacks during the course of an uptrend are entirely natural.

CryptoThies, another popular analyst on Twitter, spoke about this in a recent tweet, explaining that it is part of a “rinsing/repeating” pattern that has been seen several times throughout Bitcoin’s history.

“$BTC Bull run in 2015-2017 included run-ups, typically followed by a retrace to touch the top of the prior high. These drops ranged from 31-40%, before rinsing/repeating onward. Looks very similar to what we are seeing now,” he explained.

Whether or not this pattern is a natural one or one that spells trouble for BTC will likely grow increasingly clear in the coming days as weeks as the cryptocurrency continues to struggle to hold above $10,000.

By Cole Petersen

Alan Zibluk Markethive Founding Member
Bitcoin Price Analysis – Bitcoin Stands on its Feet by Gaining Almost 35

Bitcoin Price Analysis -  Bitcoin Stands on its Feet by Gaining Almost 3.5%

Bitcoin Price Analysis – Bitcoin Stands on its Feet by Gaining Almost 3.5%

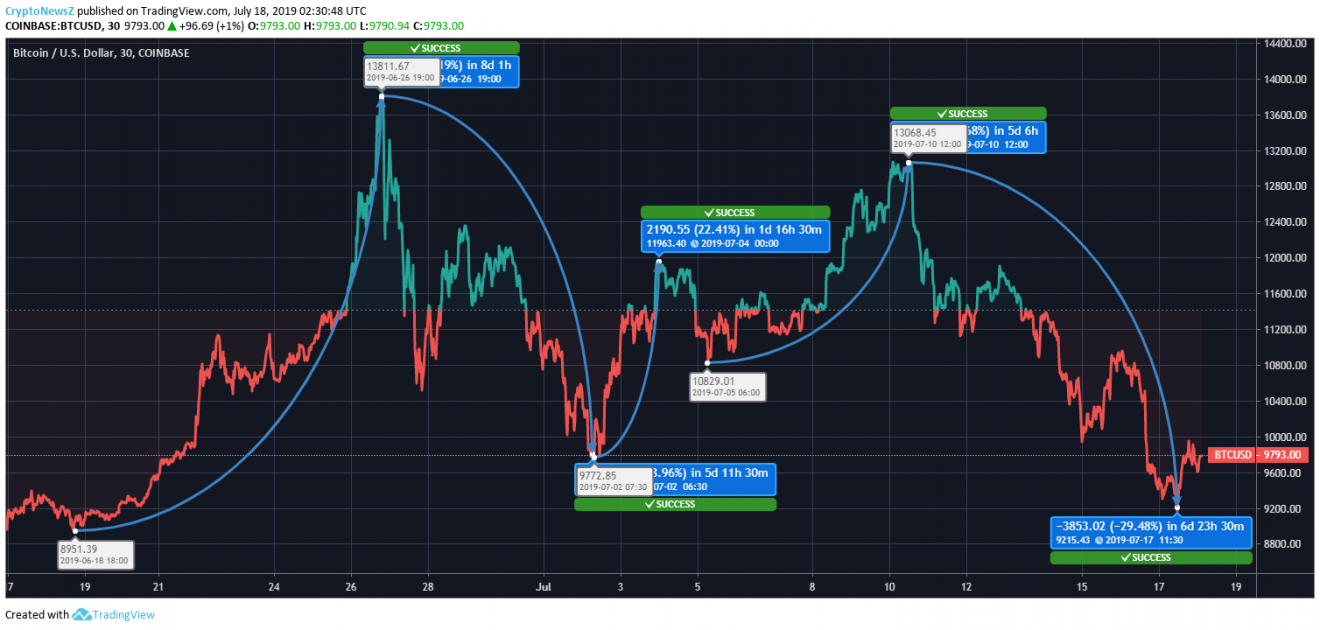
  • Bitcoin has shown five huge price swings in the last one month.

  • The next resistance point is likely to be 10,000 USD.

After being hit by a steep push to the ground, Bitcoin has been partly successful in getting on its feet again. It lost almost 14% overnight yesterday, but over the last 24 hours, it has added almost 3.5% to its price. As per the experts’ views, the coin is likely to have a bullish ride till the end of this year. The price target for 2019 should be 15,000 USD. Let us look at the current details now.
 

Statistics-BTC Price S

Bitcoin (BTC) 18th July 02:30 UTC

Rank 1st

ROI (Return on Investment) 7,119.85%

Coin Circulation 17,823,575 BTC

Market Cap 174,167,969,639 USD

Value in USD 9,793.00 USD

All-Time High 20,089 USD

24h Volume 24,064,315,046 USD
 

BTC to USD Price Comparison-Over the last 30 days, BTC has shown five major price variations. The first variation was a hike of 54.19% and the coin gained 4850 USD between 18th June and 26th June. This hike was followed by a steep fall of 28.96% between 26th June and 02nd July. This fall cost the coin 3999 USD. And over the next one day and 16 hours, the coin again gained 22.41%. The next variation happened over five days from 05th June. This hike added 20.68% to the coin. It was followed by a steep fall of 29.48% between 10th June and 17th June. This fall cost the coin 3853 USD. The Market Cap on 18th June was 162,798,824,411 USD, and the value of each coin was 8951.39 USD. The current market cap and the value of each coin are respectively 6.98% and 9.40% more than the figures for the last month.
 

Bitcoin Price Prediction-

Bitcoin is likely to have a bullish run until the end of 2019. The coin may reach 15,000 USD by the end of 2019. The next resistance points are 10050.24 USD, 10406.68 USD, and 10850.24 USD. The support levels are 9250.24 USD, 8806.68 USD, and 8450.24 USD. Bitcoin is likely to have a good time in the coming days.


Mehak Punjabi 21 hours ago

Alan Zibluk Markethive Founding Member

House Rep Kevin McCarthy heaps praise on Bitcoin

House Rep. Kevin McCarthy heaps praise on Bitcoin

  • McCarthy said that he likes Bitcoin because of the blockchain's security.

  • Unlike Bitcoin, he doesn't like Facebook's Libra and fears that it may control the market in the future.

In a recent interview with CNBC, Kevin McCarthy, the Republican House Minority Leader said:
 

"I like bitcoin … The real thing I like when it comes to bitcoin is I like blockchain because I like the security. I want the government to start using blockchain,"


Though Bitcoin and Libra are cryptocurrencies that use blockchain technology, the difference is that a sovereign currency does not back Bitcoin. On the other hand, Libra is a stablecoin backed by an assortment of government-backed currencies. McCarthy is concerned about their apparent lack of decentralization:
 

"When I'm on Facebook, I'm not the customer, I'm the product. Facebook is free because they sell your data to make money. Now they want to get into the business, and they're not Bitcoin, in this Libra. They're not decentralized."


McCarthy said that he was looking to determine whether Facebook has considered its 'potential anti-competitive behavior':

"I want to see decentralization because Libra concerns me that they're going to control the market."
 

Fellow Republican Pat Toomey, on the other hand, is willing to have a more open mind about Libra. He told CNBC:


"I don't want to presume in advance that we've got to prevent the development of some new innovation..I am very curious about what the ultimate business motive is for Facebook here."

Rajarshi Mitra

FXStreet

Alan Zibluk Markethive Founding Member
Bitcoin price plunges following Senate hearing into Facebook’s Libra cryptocurrency

Bitcoin price plunges following Senate hearing into Facebook's Libra cryptocurrency

Bitcoin price plunges following Senate hearing into Facebook’s Libra cryptocurrency

The price of bitcoin plummeted Tuesday after a Senate hearing that questioned a Facebook Inc. executive on Libra, the company’s proposed cryptocurrency.


Bitcoin fell 12% today to a 24-hour low of $9,266.56 as of 10:45 p.m EDT before recovering slightly, to $9,402.28, an hour later. The decline means bitcoin hit its lowest level in a month, extending a bear market that saw bitcoin start to plunge following news of a crackdown on bitcoin mining in China over the weekend.

Bitcoin itself isn’t directly related to Facebook’s Libra, but it’s the attitude held by those in power and the potential to impose new laws that has spooked cryptocurrency markets.

David Marcus, the head of Calibra, the Facebook-owned division that plans to provide Libra services, testified before the Senate Banking Committee that the cryptocurrency would be regulated in Switzerland, but he did not find a receptive audience. Despite Marcus clearly stating that Libra would comply with all U.S. regulations and that Calibra itself would be regulated by the U.S. Department of Treasury’s Financial Crimes Enforcement Network, the senators on the committee were skeptical.

Democratic Senator Sherrod Brown led the anti-Facebook push, saying that “like a toddler who has gotten his hands on a book of matches, Facebook has burned down the house over and over, and called every arson a learning experience.” He added, “We would be crazy to give them a chance to experiment with people’s bank accounts, and to use powerful tools they don’t understand, like monetary policy, to jeopardize hardworking Americans’ ability to provide for their families.”

The disdain for Facebook and Libra was bipartisan, with Republican Senator Martha McSally saying that “I don’t trust you guys” and “instead of cleaning up your house you are launching into a new business model.”

The reaction to Libra from Washington D.C. has been negative from the day it was announced. Both sides of politics criticized it June 18, with President Trump joining the pile-on July 11. Pre-judging Marcus’ testimony, Democratic Congress members started circulating a proposed law July 15. The “Keep Big Tech Out of Finance Act” would ban large tech companies from providing financial services, including digital currencies.

The negative reaction to Libra has led to fears that a crackdown by lawmakers on Libra could involve a legal crackdown on all cryptocurrencies, bitcoin included. “The Libra announcement has heightened the need for policymakers and regulators to establish clear rules of the road,” Banking Committee Chairman Mike Crapo told CNN.


BY DUNCAN RILEY

Alan Zibluk Markethive Founding Member

Bitcoin’s recovery stalled on approach to 11000

 Bitcoin's recovery stalled on approach to $11,000

Bitcoin's recovery stalled on approach to $11,000

  • Bitcoin and major altcoins have recovered from the recent lows.

  • The upside momentum has faded away on the approach to critical resistance levels.

The cryptocurrency market is recovering after a sharp sell-off registered during the weekend. Bitcoin (BTC) and all major altcoins are gaining ground, though the critical resistance levels have yet to be broken.

The total capitalization of all digital assets in circulation jumped to $291 billion from $272 billion this time on Monday. The total trading volume is registered at $71 billion, while Bitcoin's market share increased to 66.6%, the highest since April 2017.

Top-4 coins price overview

Bitcoin (BTC/USD) is hovering around $10,800 after a short-lived dip below $10,000 during early Asian hours on Monday. The first digital coin has gained over 7% in recent 24 hours and stayed unchanged since the beginning of the day as the recovery momentum has faded away on approach to the critical resistance level of $11,000.
 

Ethereum, the second largest digital asset with the current market capitalization of $24.6 billion, is also in recovery mode. ETH has grown by 5% in recent 24 hours and settled above $230.00 on Tuesday, moving away from the recent low of $202.80. However, on short-term timeframes, the coin is moving within a bearish trend as an upside momentum is fading.

Ripple's XRP has gained 3.4% since this time on Monday to trade at $0.3166 by the time of writing. The third largest digital asset with the current market capitalization of $13.4 billion settled above $0.31 handle, though the recovery is capped by $0.3200.

Litecoin (LTC/USD), now the fourth largest digital asset in the global cryptocurrency rating, is losing ground on Tuesday. While staying in a green zone on a day-to-day basis, LTC/USD has lost about 1.5% in Asia. At the time of writing, LTC/USD is changing hands at $88.90, off the intraday high of $91.79 hit during early Asian hours.


Tanya Abrosimova

FXStreet

Alan Zibluk Markethive Founding Member

Bitcoin price analysis – BTCUSD loses over 1000 in a matter of hours the worst not over yet


Bitcoin price analysis – BTC/USD loses over $1,000 in a matter of hours, the worst not over yet

  • BTC/USD retreated below $12,000 after a short-lived spike above $13,000

  • Intraday RSI implies that the sell-off is not over yet.

Bitcoin is changing hands at $11,850 after a strong sell-off from the recent high of $13,195. The first digital currency lost over $1,000 of its value in a matter of hours and settled under $12,000 to much disappointment of BTC bull that expected to see it at new 2019 highs. BTC/USD has lost over 8% in recent 24 hours and nearly 3% since the beginning of Asian trading on Thursday. All major altcoins have also extended the decline.

While the fundamental reasons behind the sell-off remain unknown, it is worth noting that the move was accompanied by a spike in trading volumes, which means that traders were locking profits after a strong upside move

Bitcoin's technical picture

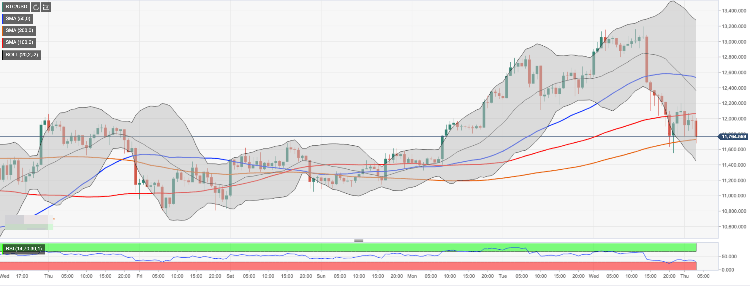
The initial resistance for BTC/USD comes at $12,000. This psychological barrier is strengthened by SMA100 (Simple Moving Average) on the 1-hour chart. It is followed by the middle line of the 1-hour Bollinger Band at $12,360 and SMA50 (1-hour) at $12,550.

Once this barrier is cleared, the recovery may be extended towards $13,000 and $13,300 (upper boundary of 1-hour Bollinger Band).

On the downside, the initial support lies at $11,600 created by SMA100 4-hour. This barrier is followed by $11,300 (the lower boundary of 4-hour Bollinger Band) and psychological $11,000. Considering the downward-looking RSI (Relative Strength Index) on the intraday charts, further sell-off towards the above said support area looks likely.

BTC/USD, 1-hour chart


Tanya Abrosimova

FXStreet

Bitcoin price analysis -  BTC/USD loses over $1,000 in a matter of hours, the worst not over yet

Alan Zibluk Markethive Founding Member