Tag Archives: bitcoin bulls

Bitcoin Moving in a 400 Range with Resistance at 4700

Bitcoin Moving in a $400 Range with Resistance at $4,700

Bitcoin Moving in a $400 Range with Resistance at $4,700

The path of least resistance is clear and as long as prices are trading below $4,700 then we could see further declines towards $3,000 or lower. But even as analysts and investors track price, the survival of Bitcoin conjures memories of the dot com bubble. It did burst; birthing Amazon and Google, companies that wield so much control with individual market caps more than triple that of cryptos.

Latest Bitcoin News

Much has been talked about price, the collapse and the effect of low trading volumes. In fact there has been some comparison about the current bear market and the dot com bubble. Well, this isn’t the deepest correction Bitcoin traders have had to contend. Back in 2013-14, losses were deeper and prices more volatile mostly because of thin trading volumes as investment channels were few and Bitcoin not as common as it is now.

Regardless, blockchain and Bitcoin is a solution that is here to stay. Just like Paul Krugman, a non technical financial guru of yester years said the internet was a fad and famously suggested it would be no more transformational than the fax machine, current nay sayers as Jamie Dimon and Roubini or Dr Doom will surely watch as the technology shape and disrupt current systems.

While the contention is different there is strong correlation between events around the dot com bubble and recent discussions around DLTs, public blockchains and even competing protocols as IOTA. The mass is split and some are betting on IBM’s HyperLedger–interoperability, others on Bitcoin—security and community and more on the IOTA and the internet of things.

However, many are backing open source solutions to prevail over permissioned systems just like TCP/IP did nurturing current mega-corporations as Google and Amazon. If that is the case then the stars are sparkling for Bitcoin investors.


BTC/USD Price Analysis

Weekly Chart

Like before, the top down overview is pretty clear—BTC/USD is in a meltdown and poised to lose more as trading volumes dry up and the so called whales cover their positions to stay profitable. But, thing is even as bear pressure rage and threaten to wipe out 2017 super gains, prices have been stable in the last few days.

Moving within a tight $4,300-$4,700 range, there is obvious support. If prices close above $4,500 then odds are we might see prices recover above $5,000 and towards $5,500 as laid out before. Conversely, strong losses below $4,000 could open a flurry of sell orders pushing BTC towards $3,000–$3,500 from where analysts expect prices to find strong support.
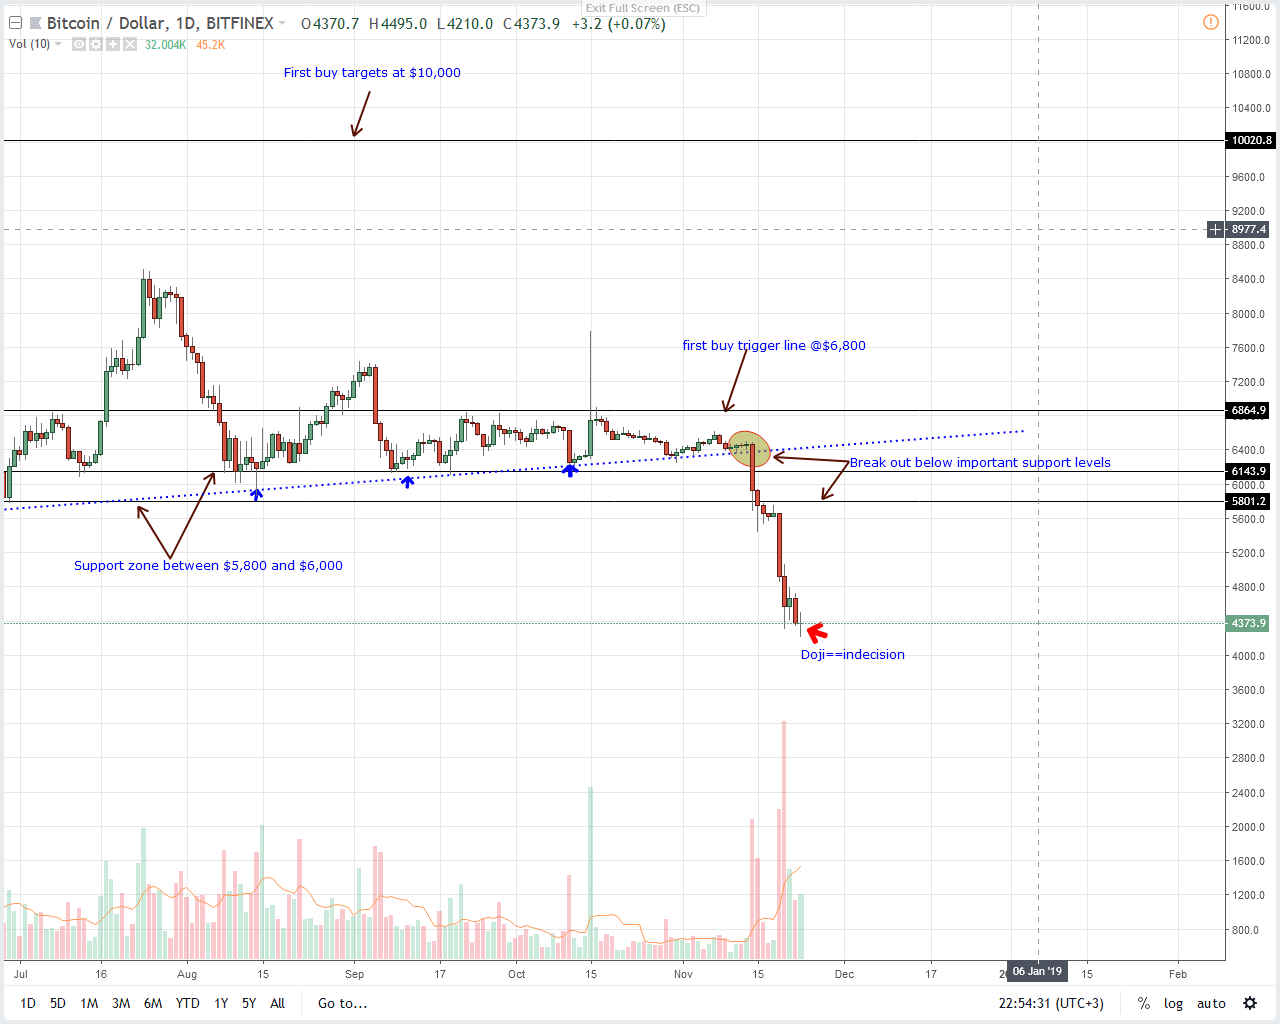
The significance of $4,300–$4,500 support is beginning to show in the daily chart. Here, we have a doji bar, a mark of overall market indecision but still trading volumes are light.

Nonetheless, this did shore prices confining movements within a $200 range of which we expect buyers to build their momentum on.

Now, if today ends up as a bull, closing above immediate resistance of $4,700 then our previous upbeat BTC/USD price forecast would most likely go live as buyers thrust prices above $5,000 towards $5,500. If not and BTC capitulate below $4,000 then we shall trade as above.

All Charts Courtesy of Trading View


by DLT Guru November 24, 2018

Alan Zibluk Markethive Founding Member

Bitcoin BTC Finds Support at 4200 What Next?

Bitcoin (BTC) Finds Support at $4,200, What Next?

Bitcoin (BTC) Finds Support at $4,200, What Next?

After a brief recovery mid-week that hinted at a possible bottom found, a fresh crash has decimated the cryptocurrency market this morning. After dipping sharply from $4,440, Bitcoin (BTC) managed to find support at $4,200, which has long been considered a critical support level. Should it breach it, though, the next test will likely be $3,000 – the level that buoyed up the markets in the brief September dip last year before the epic late November rally.

While last weeks drops have been attributed by some to be investors selling assets ahead of Black Friday, these new losses are too close to the time for that explanation. It’s more likely that these continuing declines are fuelled by a number of factors, including depressed tech stocks as a result of the on-going China-U.S. trade war, the DOJ’s Tether manipulation probe and the Bitcoin Cash (BCH) war that is driving hash power away from Bitcoin mining.

There is also mounting evidence to suggest price manipulation by Wall Street whales in order to accumulate ahead of the ICE’s Bakkt launch, although that little nugget of hope has now been delayed until late January next year, so if true, we may see similar dips again after New Years.
 

Black Friday Fever

Several exchanges have chosen to take advantage of Black Friday fever and sell assets at discount prices, with some going as far as giving away Bitcoin for free. Unfortunately, while these actions may grow adoption, they also serve to further devalue cryptocurrencies in the short term.

After the drop to around $4,150 on some exchanges earlier today, Bitcoin has shown signs of recovery, rallying up to the $4,250 range more recently. Whether or not this support will hold is unclear, with many bearish analysts becoming more and more convinced that Bitcoin’s real bottom is likely to be in the $3,000 range. Should it maintain support above $4,200, the next resistance level is $4,720 with strong resistance at $4,830.

Any analytical comparisons to last year’s epic mid-December bull run don’t hold up within today’s vastly altered landscape. In light of the BCH hash war, tighter SEC regulations, more substantial institutional interest, and an entirely different psychological viewpoint, to assume a similar event would happen this year is optimistic at best. However, considering that last years rally was almost certainly the result of market manipulation and left the majority investors in debt, maybe that’s a good thing.

AUTHOR Mark Hartley November 23, 2018, UTC, 4:41 am

Alan Zibluk Markethive Founding Member

Bitcoin price latest update: Cryptocurrency value to INCREASE due to high US debt level

Bitcoin price latest update: Cryptocurrency value to INCREASE due to high US debt level

ShapeShift CEO Erik Voorhees has said cryptocurrencies will boom during the next global financial crisis. The finance expert at the global trading firm believes the high level of US debt will cripple the economy unless more money is printed. He argues this will lead to an increase in cryptocurrency investment.

He said: “When the next global financial crisis occurs, the world will realise organisations with $20trillion in debt can’t possibly ever pay it back.

“Thus must print it instead, and thus fiat is doomed.

“Watch what happens to crypto.”

US lawmakers keep increasing the country’s debt ceiling, allowing for the federal government to take on more and more debt.

His theory is the debt level of world economies is unsustainable and will put states under pressure the next time there is a financial crash.

As a result, he believes quantitive easing will have to come into force, the process whereby governments print money, to help pay off the money they owe.

The more money in circulation the less it is worth, meaning ordinary families could be set to see their savings decrease in value.

Mr Voorhees believes this in turn could lead to more people investing in cryptocurrencies.

However, digital currencies are also a financial risk for investors due to their history of extreme volatility.

In 2017, Bitcoin’s value rocketed to more than double its value, reaching a high $19,783 in December.

However, it then plunged in 2018 to a low of less than $6,000 in June.

Since then the online money has stabilised and has seen no major rises or falls in its value.


City & Business | Finance

11/11/2018


Alan Zibluk Markethive Founding Member

Bitcoin holding strong resistance at 65006550

Bitcoin holding strong resistance at 6500/6550

Bitcoin holding strong resistance at 6500/6550


Bitcoin holding strong resistance at 6500/6550 keeps the outlook negative targeting 6400 (now hit). This is the best support for today & therefore a break below 6350 is a sell signal targeting 6320 & 6220/6200 (we bottomed exactly here last week) before the October low at 6100/6055. A break below 6000 is the next sell signal targeting 5900/5880 & the low for this year at 5780. This is NOT expected to hold for long in the bear trend.

Quite strong resistance at 6500/6550 (this trade worked perfectly) but shorts need stops above 6600. Bulls are only in control on a break above here. We then need a break above 6760 to target 6825 & strong resistance at 7000/7050.


Jason Sen

DayTradeIdeas.com | 05:16 GMT

Alan Zibluk Markethive Founding Member
Bitcoin BTC Aiming for 7000 Next?

Bitcoin (BTC)  Aiming for $7,000 Next?

Bitcoin (BTC) Aiming for $7,000 Next?

Bitcoin Price Key Highlights

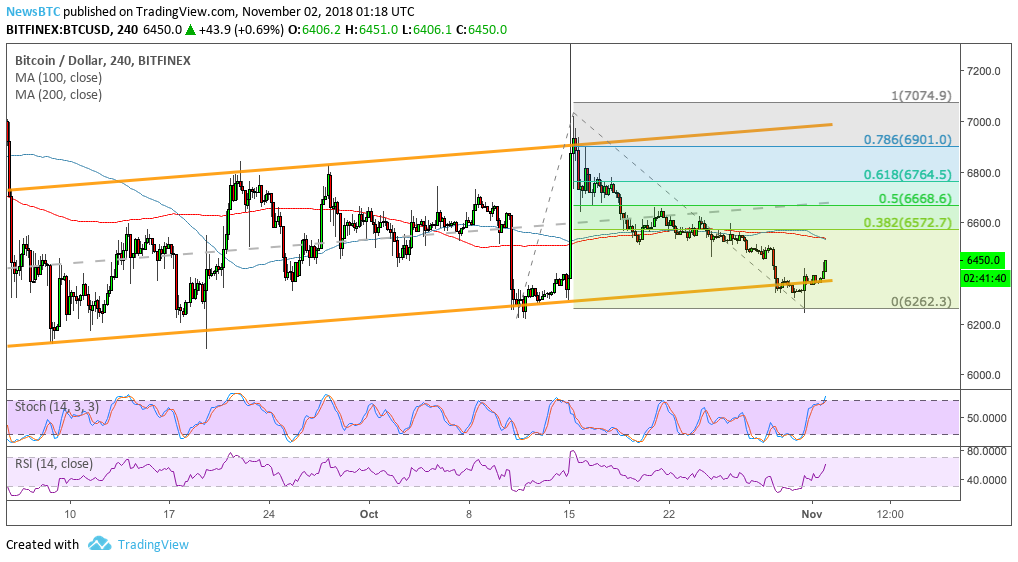
  • Bitcoin price is gaining traction on it bounce off the channel support on its 4-hour time frame.

  • A move to the next upside targets might be in the works and the Fibonacci extension tool marks these.

  • Technical indicators are hinting at weakening bullish momentum, though.

Bitcoin price looks ready to resume its climb and might aim for these upside targets marked by the Fib tool.
 

Technical Indicators Signals

The 100 SMA seems to be crossing below the longer-term 200 SMA to indicate that bearish pressure might return, but it could also be a delayed reaction to the latest slide. If the short-term MA is able to hold its head above the 200 SMA, it could reinforce the presence of bullish momentum.

Bitcoin price could aim for the 38.2% Fib extension from here as this lines up with the dynamic inflection points at the moving averages. The 50% level lines up with the mid-channel area of interest around $6,700 and the 78.6% level lines up with the top of the channel at $6,900. The $7,000 mark might also serve as psychological resistance just before the full extension at $7,075.

Stochastic is heading north so bitcoin price might follow suit while buyers are in control. However, the oscillator is nearing overbought levels to signal exhaustion and a possible return in bearish pressure. RSI has more room to go before hitting overdone levels, which means that buyers could stay in the game for a bit longer.

Bitcoin price seems to be rebounding from a rough start this week as a brand-new month is setting in. This typically brings more optimism and reopening of positions after booking profits at the end of the month, which also coincides with futures settlement.

Besides, the ICE Bakkt bitcoin futures are rumored to be in the works and might usher in stronger volumes and increased activity this November.


SARAH JENN | NOVEMBER 2, 2018 | 1:33 AM

Alan Zibluk Markethive Founding Member
Bitcoin Price – BTCUSD Approaching Area of Interest

Bitcoin Price - BTC/USD Approaching Area of Interest

Bitcoin Price – BTC/USD Approaching Area of Interest

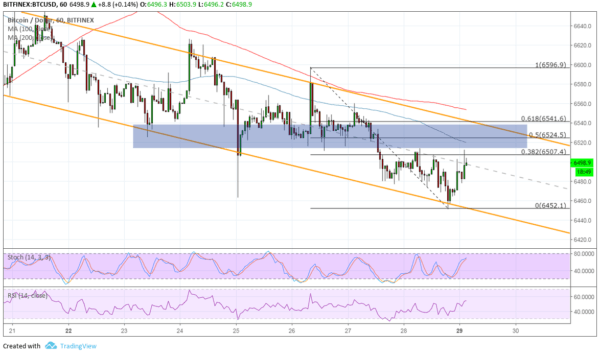
Bitcoin is still trending lower inside its short-term descending channel but might be due for a bounce to the top. Support held and a correction to the Fibonacci retracement levels is underway.

Price is testing the 38.2% Fib currently, and this happens to line up with the mid-channel area of interest. Holding as resistance could send Bitcoin back to the swing low around $6,450 or the channel support closer to $6,425. A larger correction could test the 50% Fib that lines up with a former support area that might now hold as resistance, as well as the 100 SMA dynamic inflection point.

The 61.8% Fib is just below the 200 SMA dynamic inflection point and close to the channel resistance, which might be the line in the sand for a correction. The 100 SMA is below the longer-term 200 SMA to indicate that the path of least resistance is to the downside. In other words, the downtrend is more likely to resume than to reverse. The gap between the moving averages has been widening to signal strengthening bearish momentum.

Stochastic is heading higher to signal that bulls still have some energy left, and the oscillator has some room to climb before hitting overbought conditions. RSI also has some ground to cover before bulls are exhausted, which suggests that the correction could go on for a bit longer before sellers return.

Pic

Bitcoin might even have enough momentum to break past the channel top, provided market updates also turn out positive. As it is, investors still seem to be holding out for more directional clues and hoping to get confirmation that the earlier rallies might be sustained.

Institutional investment could be a strong factor, but that might have to wait until early next year. The near-term catalyst would likely be the bitcoin futures on ICE Bakkt and it appears that traders are waiting to see how this might impact prices first.


SARA JENN · OCTOBER 29, 2018 · 1:30 AM

Alan Zibluk Markethive Founding Member
Bitcoin Can the Bulls Muster Up a Weekend Rally?

Bitcoin – Can the Bulls Muster Up a Weekend Rally?

Bitcoin – Can the Bulls Muster Up a Weekend Rally?

Bitcoin stuck in the ranges through the early part of the day, with the Bitcoin bulls needing to put some life back into the market to support a breakout.

Price action through the week was limited for Bitcoin, with a 0.06% gain on Friday one of only two days in the week where Bitcoin managed to avoid the red.

3-days in the red left Bitcoin down 0.88% for the current week, with Bitcoin now having fallen short of the 23.6% FIB Retracement level of $6,757 since 18th October, as the steam comes out of Bitcoin and the broader market.

After a relatively range bound start to the day on Friday, Bitcoin rallied to a morning high $6,597.4, breaking through the first major resistance level at $6,575.57 before falling back to the earlier part of the day’s ranges, with resistance at $6,600 pinning Bitcoin back on the day.

An early afternoon intraday low $6,511 held well above the day’s first major support level at $6,469.77, leaving Bitcoin at $6,500 levels through the day, a rare occurrence in the world of Bitcoin and reflective of the lack of volatility in the market.

On the news front, there was some chatter on SEC Commissioner Kara Stein’s view on the setting up of cryptocurrency funds, Stein stating that some internal guidelines on key considerations had been circulated, while she held back from confirming whether any regulated exchange traded funds would be approved before the end of the year.

The regulatory landscape continues to be one of the key obstacles for the SEC to give the green light, with the SEC Commissioner highlighting that there remains a need to get clarity on a range of regulatory issues before the markets can expect institutional money to flood in.

For now the cryptomarket and the Bitcoin bulls in particular, remain optimistic that the SEC will at least give the green light to the VanEck Bitcoin ETF, though it remains to be seen whether issues surrounding valuation, liquidity and custody have been sufficiently addressed.

At the time of writing, Bitcoin was up 0.33% to $6,552.9, with Bitcoin moving from a start of a day morning low $6,524.9 to a morning high $6,560 before easing back, the moves through the early part of the day leaving the day’s major support and resistance levels untested.

For the day ahead, a hold on to $6,550 levels would support a move through the morning high $6,560 to bring the day’s first major resistance level at $6,582.73 into play, while we will expect Bitcoin to fall short of $6,600 levels for a 3rd consecutive day, with the news wires likely to remain relatively silent on the regulatory front through the weekend.

Failure to hold on to $6,550 levels through the morning could see Bitcoin give up the morning’s gain to pullback through the start of the day morning low $6,524.9 to call on support at $6,496.33 before recovering, more material losses unlikely barring particularly negative news hitting the crypto wires.

Looking at the broader market, with Bitcoin’s dominance holding at around 53.6% and the crypto total market cap hovering at around $210bn, there’s been very little action across the majors with Ethereum continuing to hold onto the number 2 spot, Ripple’s XRP struggling to close the gap in spite of the Ripple team’s successes in the real world.


Bob Mason

43 minutes ago

Alan Zibluk Markethive Founding Member

Bitcoin BTC Price Analysis – Which Direction Can It Break Out?

Bitcoin (BTC) Price Analysis - Which Direction Can It Break Out?

Bitcoin (BTC) Price Analysis – Which Direction Can It Break Out?

Bitcoin is stuck in consolidation for yet another day as it moves back to the triangle bottom.

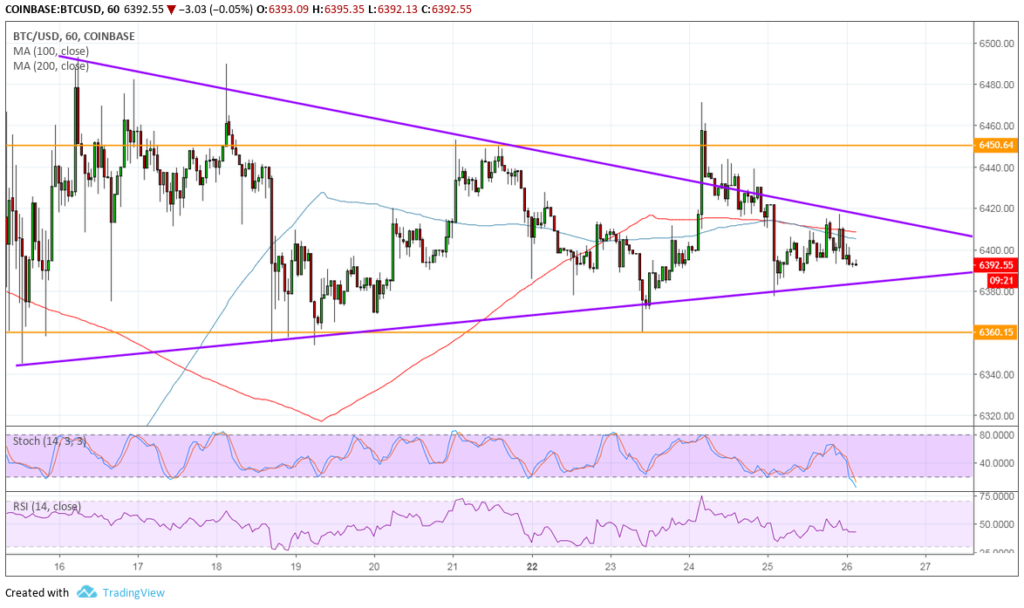
Bitcoin continues to move sideways inside a symmetrical triangle and range visible on the short-term time frames. Price recently bounced off the range resistance and also the top of the triangle, setting its sights back on the bottom.

The 100 SMA is below the longer-term 200 SMA to confirm that the path of least resistance is to the downside. In other words, selling pressure is more likely to persist. In that case, a break of the triangle bottom might be seen, sending price to the range support at $6,360 or onto a slide that’s the same size as the consolidation patterns.

Stochastic is also heading lower to confirm the presence of bearish momentum, but the oscillator is already dipping into the oversold region to signal exhaustion. Turning back up could revive bullish pressure and allow support zones to hold. RSI is starting to turn lower after previously cruising mostly sideways, also reflecting a pickup in selling pressure.

Investors seem wary about the launch of ICE Bakkt futures possibly as early as next month, likely recalling how the CME bitcoin futures launched last year are being blamed for the sharp drop that ensued since then. There is also some degree of wariness associated with the Tether controversy.

Looking ahead, traders could continue to hold out for any major catalysts that could spur and sustain a breakout in either direction. By the way developments are going these days, it appears that there could be further upside, particularly on positive regulatory updates and progress in institutional platforms.

Note that Fidelity will be making its institutional platform for bitcoin and ethereum more widely available as early as Q1 next year so anticipation could build up leading to it. After all, it could usher in strong inflows from banks and hedge funds eager to place bets on the industry.


Rachel Lee by Rachel Lee October 26, 2018

Alan Zibluk Markethive Founding Member

Bitcoin BTC Price Watch – Bears Refusing to Let Up

Bitcoin (BTC) Price Watch - Bears Refusing to Let Up

Bitcoin (BTC) Price Watch – Bears Refusing to Let Up

Bitcoin Price Key Highlights
 

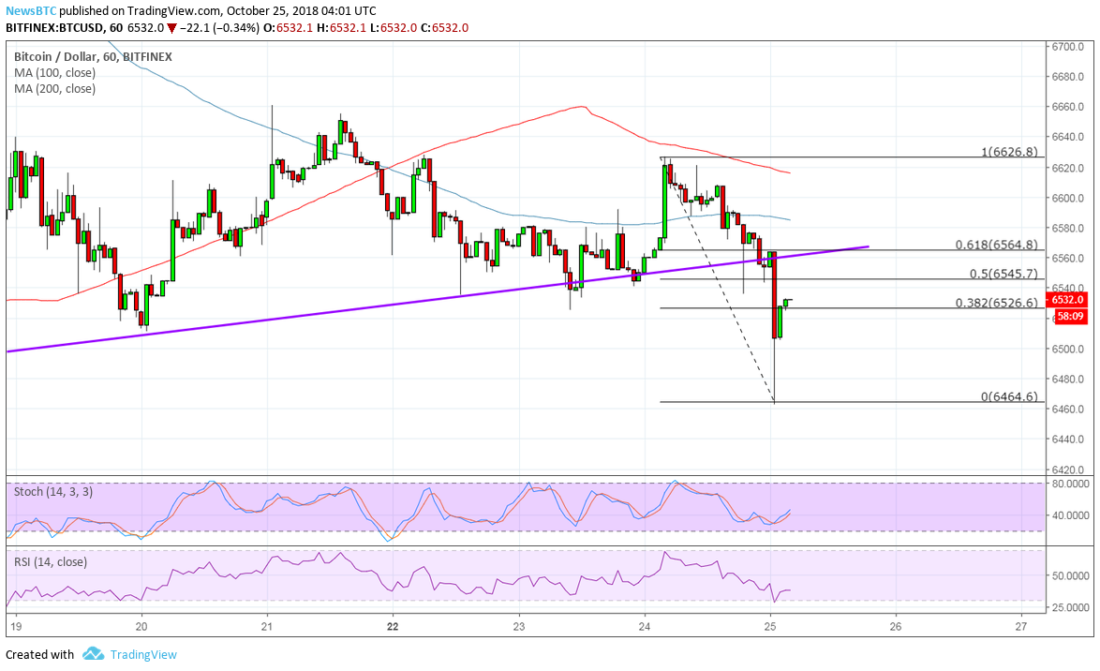
  • Bitcoin price recently tumbled below a short-term rising trend line but might be due for a pullback.

  • Applying the Fib retracement tool on the latest swing high and low shows the levels where more sellers might be waiting.

  • However, technical indicators are giving mixed signals on whether the slide could resume or not.

Bitcoin price fell through a short-term support zone and might be due for a pullback before heading further south.


Technical Indicators Signals
 

The 100 SMA is below the longer-term 200 SMA to indicate that the path of least resistance is to the downside. In other words, the selloff is more likely to resume than to reverse from here.

Sellers might be waiting around the 61.8% Fib or $6,564 level which lines up with the broken rising trend line support. This is also close to the 100 SMA dynamic inflection point, which might add another layer of resistance.

Stochastic is pulling up without even hitting oversold territory, which suggests that buyers are eager to return. Sustained buying pressure could even take bitcoin price back up above the trend line to continue its climb. RSI is also pointing up to suggest that buyers might be ready to return. Reaching overbought levels and turning back down could still allow the Fibs to hold, pushing bitcoin price back to the swing low or lower.

Bitcoin was unable to sustain its earlier pop higher as profit-taking was quick. Traders must be feeling anxious on account of risk-off flows in general financial markets and while waiting for the SEC decision on bitcoin ETF applications.

Still, there’s a lot to look forward to, particularly the launch of ICE Bakkt bitcoin futures later this year. However, there might also be some unease as traders recall that last year’s CME bitcoin futures were blamed for the sharp drop that followed then.


SARAH JENN | OCTOBER 25, 2018 | 4:24 AM

Alan Zibluk Markethive Founding Member
Bitcoin BTC Price Watch – Is This a Bullish Breakout Yet?

Bitcoin (BTC) Price Watch -  Is This a Bullish Breakout Yet?

Bitcoin (BTC) Price Watch – Is This a Bullish Breakout Yet?

Bitcoin Price Key Highlights

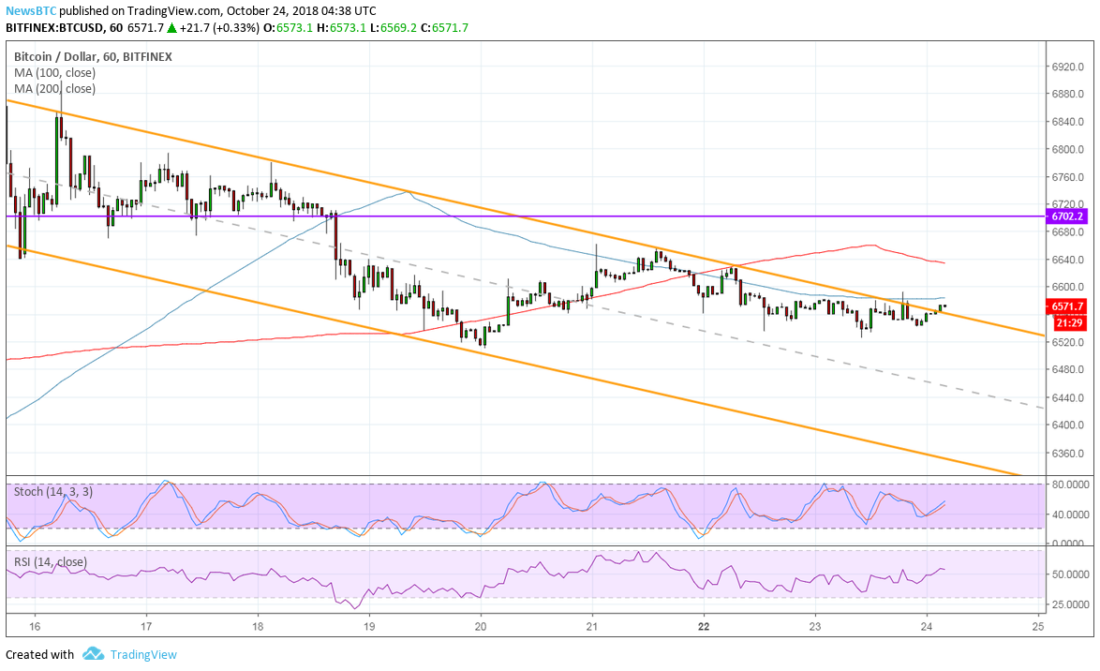
  • Bitcoin price has been trending lower inside a descending channel visible on its 1-hour chart.

  • Price appears to be attempting an upside break as a few hourly candles are closing above the channel top.

  • Technical indicators may be showing some hints of a pickup in bullish momentum.

Bitcoin price is trying to break out of its downtrend but has yet to test nearby resistance levels before sustaining a climb.
 

Technical Indicators Signals

The 100 SMA is below the longer-term 200 SMA to signal that the path of least resistance is to the downside. In other words, the downtrend is still more likely to resume than to reverse. Then again, the gap between the two moving averages is narrowing to signal slowing selling pressure and a potential bullish crossover.

Bitcoin price has yet to break past these dynamic inflection points before confirming a climb, though. And even then it would likely encounter some resistance at the $6,700 mark on its move north.

Stochastic is turning higher without even reaching the oversold area, indicating that buyers are eager to return. RSI is also on the move up and has a lot of ground to cover before reaching the overbought zone. Turning lower from that area could lead to a return in selling pressure, possibly at any of the nearby resistance levels.

Bitcoin price continues to wait for another set of positive catalysts that could allow the earlier surge to resume. For now, it is dealing with risk aversion in financial markets and uncertainty on the SEC decision for bitcoin ETF applications.

Traders might also be taking it easy leading up to the launch of ICE Bakkt bitcoin futures, especially since the ones from CME were blamed for the drop in price late last year. Still, bitcoin has a lot to look forward to in Q1 to Q2 next year on the Fidelity institutional platform.


SARAH JENN | OCTOBER 24, 2018 | 4:52 AM

Alan Zibluk Markethive Founding Member